Inglês (pdf)
 Artigo em XML
 Referências do artigo
 Enviar este artigo por email
 Citado por SciELO
  Citado por Google
  Similares em
SciELO
Similares em
SciELO  Similares em Google
 Permalink
1. INTRODUCTION
Colombia has one of the cleanest energy generation matrices in the world. At the end of 2018, the installed capacity in the National Interconnected System was 17.312 MW: 68.4 % corresponds to hydraulic generation, almost 30 % corresponds to thermal generation, and approximately 2% corresponds to non-conventional and renewable energy sources [1]. An energy matrix highly dependent on hydrological resources makes the Colombian electricity system vulnerable to drought phenomenon, such as El Niño. During dry periods, the electricity generation is highly dependent on thermal sources, incurring high generation costs and higher greenhouse gas emissions.
The electricity system vulnerability could be reduced with the diversification of the energy generation matrix, specially using non-conventional renewable energies. Therefore, the Colombian Government plans to increase the share of non-conventional energies in the energy matrix from 2% to between 8% and 10% in the next 4 years. Its location on the equatorial axis, climatic conditions, and high solar radiation levels make Colombia an emerging market in solar photovoltaic (PV) energy. According to IRENA, the installed capacity of solar PV energy in Colombia was 86.52 MW in 2018, growing approximately 700% vis-à-vis 2017 [2].
The success of a widespread growth of solar PV energy use is highly dependent on overcoming technological and knowledge barriers associated with design rules and parameters, equipment selection, operation and maintenance (O&M) strategies, and business model generation. Understanding the technology and minimizing its risks demand support the execution of studies on operational performance and reliability of these systems. According to Quansah et al. [3], these studies are important for various actors along the solar PV value-chain; from institutions involved in basic research, to those engaged in project development, system integration, field deployment, and operations and maintenance services.
To evaluate operational performance, degradation and reliability of solar PV systems, several studies have been carried out around the world. Mussard et al [4] present a review of the variation of performance of photovoltaic modules depending of technologies and environmental factors in arid and semi-arid climates. They state that these types of climates offer high radiation level; however, a very careful assessment of the environmental parameters is required before selecting the appropriate technology. Factors such as high temperatures and high dust concentration tend to decrease the performance ratio. Quansah et al [3] studied the performance degradation in twenty-two mono-crystalline silicon modules exposed for 16 years in northern Ghana. Their results show that the maximum power of the modules had declined by 18.2% -38.8% over the period, and defects such as discoloration of the encapsulant and degradation of the junction-box adhesive were the most frequently observed. Quansah et al [5] explored the performance degradation of five solar photovoltaic module technologies within the first 14 months of operation in Kumasi Ghana. Its results show that early degradation ranged from 8% to 13.8% of initial performance. Silvestre et al [6] assessed the performance and degradation rate of three different crystalline silicon-based photovoltaic modules located near Algeria's Sahara, during three years. They found degradation rates ranging from 0.58%/year to 1.92%/year.
This study presents the results of the performance and early degradation assessment of a 180.8 kWp rooftop on a grid-connected photovoltaic system, installed in Barranquilla, city located in northern Colombia, during its first year of operation. Two methods were used to assess the performance and early degradation: i) Estimation of solar conversion efficiency, and ii) visual inspection. The first method includes a cross analysis between climatic conditions, irradiance levels and the generated energy downstream inverters. To calculate the plane irradiance, a correction factor is proposed, using the global irradiance. In addition to a cost analysis aimed at identifying how much money the non-generated energy represents. The second method consists of periodical visual inspections of installed modules to observe if there is any of the following degradation modes: Discoloration, delamination, busbar corrosion, cracking of solar cell, glass breakage, anti-reflection coating and solder bond. The results show the solar conversion efficiency one month before and one day after the cleaning process. This parameter increased by 2.98% after the clean-up. There was an early performance degradation rate of 0.05%/day during highest dirty concentration days. The physical degradation analysis shows discoloration as the most common failure mode. However, there is no substantial contribution of this failure mode on module temperature, so far.
2. PHOTOVOLTAIC PERFORMANCE DEGRADATION DUE TO TROPICAL ENVIRONMENTAL CONDITIONS
Back in 2012, the National Renewable Energy Laboratory (NREL) of the United States published a performance degradation survey for PV systems installed in USA, Japan, Australia, and the European Union [7]. That study showed that 78% of published research indicated a degradation rate below 1% per year. However, it also opened the gap to new unknowns about the subject, such as its linearity, and its variation due to climate conditions [8]. Regarding degradation of PV systems in tropical regions, newer studies suggest that it is between 0.3% and 1.9% per year for several PV technologies, showing that the level of mismatch plays an important role in its degradation, which means a decrease in output power of around 10% to 50% in a 25 lifetime [9], [10]. Soiling is another significant factor with a strong effect on degradation and power loss of PV systems. The study developed by Guo et. al. at Doha desert specify a performance loss due to soiling around 0.0042 +/-0.008 per day for modules cleaned every six months, and 0.0045 +/-0.0091 per day for modules cleaned every two months [11]. As it refers to precipitation, it can potentially have a positive effect from cleaning. Nevertheless, as indicated by Mussard and Amara [4], humidity can cause some damage to PV modules due to the absorption of the rays by water vapor molecules. It is suggested that the optimal situation would undergo intense precipitations followed by long and stable periods of dry sunshine. It also indicates that the crystalline technologies are more resistant to aggressive climate conditions, having a slight superiority of multi-Si over the mono-Si, whilst thin film technologies are heavily impacted by degradation in this climate, which is apparently a a major challenge for this technology under arid conditions.
Predicting the effect of degradation is another gap requiring a significant research efforts and statistical analyses. Huang and Wang numerical research [12] showed that the characteristic parameters of degradation are very difficult to obtain, as determined by the aforementioned studies, which need to be highly correlated to the technology and the climates that the PV systems must withstand For operating PV systems, there are also some methods that can be used to determine degradation in a non-invasive way. Katayama et. al. [13] showed an analysis technique based on impedance spectroscopy to developed Nyquist plots, which were then compared against the l-V characteristics of the PV modules, determining that mechanical stresses move the right edge of the Nyquist plots to the low-frequency range. Moreover, Han and Lee [14] developed a method that consists in using an opaque film to cover the PV module under analysis, where the shading effect enables comparing the resultant l-V curves to determine the degradation rate of the module.
SYSTEM UNDERSTUDY.
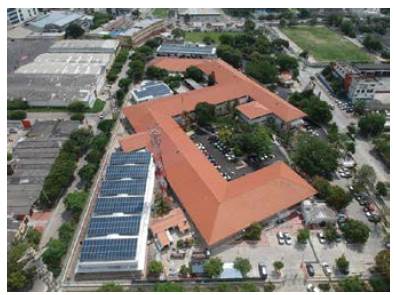
The system under study is a 180.8 kWp rooftop on a grid-connected photovoltaic system, installed in Barranquilla, in northern Colombia, It was installed in June 2018, with the objective of supplying 12% of the total energy required by the administrative headquarters of PROMIGAS S.A. E.S.P. It is made up of 574 polycrystalline solar panels, in an area of 1360 m2. The climate of Barranquilla is characterized by its high humidity (Rel. humidity 45% - 100%) and ambient temperature of 37 °C - 22 °C. Daily irradiation on an annual basis averages 5.5 kWh/m2. Average annual wind velocity at the location is 25 m/h, with the highest values recorded in the months of December, January, February and March. Precipitation records a peak of 6.77 mm/day in June, with the lowest values in January - April, averaging 767 mm/year.
Figure 1 shows the system, which is divided in three subsystems Located on three different rooftops, referred to as: Subsystem A, B and C. Each subsystem has its own inverter. The inverter corresponding to subsystem A is located in electrical substation 3, where the power generated by this subsystem is connected to the 460 Vac bar. The inverters of subsystems B and C are located in electrical substation 2, where the power generated by both subsystems is joined, and it is connected upstream of a reducing transformer of 480/214 Vac, to the bar of 214 Vac.
VISUAL INSPECTION.
Exposure to high environmental temperatures, high dust concentration, mechanical stresses, moisture, and highly corrosive environment degrade the material properties of photovoltaic modules, causing failure modes that reduce solar PV system performance [15]. Park et al [16] suggest that degradation could be classified into two groups: early degradation and long-term degradation. Early degradation includes failures modes such as discoloration and delamination of encapsulant material [17], [18] bubble of back-sheet, cracks in the cell, burnt cell caused by hot spots, and defects in anti-reflective coating. Long-term degradation includes previous failures modes in addition to corrosion of solder joint [19] and crack in solder joint [20], [21]. The degradation of photovoltaic modules is highly dependent on climate conditions and materials used.
4. MATERIALS AND METHODS
The evaluation of the variables that affect the degradation of solar PV modules requires the characterization of the type of atmosphere surrounding the system, meaning climatic conditions, and dust concentration. In order to monitor the variables, instruments such as meteorological station, atmospheric ion collectors, and dust sensors could be used for monitoring solar radiation, wind velocity, rain level, environment temperature, and moisture. To identify the above mentioned failure modes, visual and thermographic inspections are required.
Visual inspection starts prior to installation to identify possible damage caused during manufacturing and transportation, e.g. glass breakage. Once modules have been installed, an inspection must be carried out to obtain a baseline of the condition of metallic structures, surface and encapsulant, and electric system. A photographic record is recommended. Table 1 shows some failure modes associated to the material and structure of the modules.
Table 1 Failure modes according to solar PV module components
| Solar PV module component | Common failure modes |
|---|---|
| Metallic structure | Corrosion, cracks |
|
|
|
| Electric connections |
|
In the case of the system under study, visual inspections were carried out four times: i) three months after installation, ii) six months after installation, iii) One day before the first clean-up, and iv) one day after the first clean up. All inspections were carried out close to noon time, which ambient temperature is close to 34 °C. A Nikon D3500 camera of 24.2 Mpx and Fluke Thermal Imager Ti32 IR sensor size 320x240 serial 10050588 (9 Hz), were used to identify the failure modes and the effects on the module temperature.
5. RESULTS AND DISCUSSION
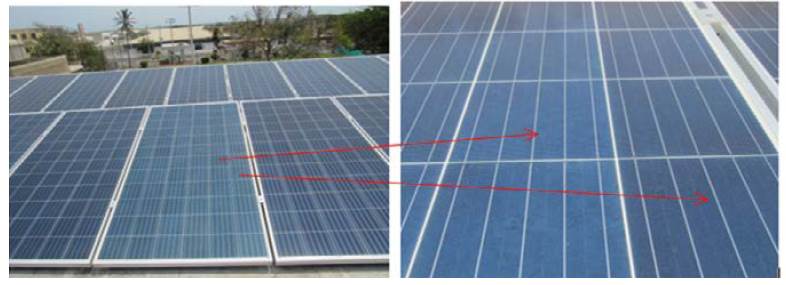
Figure 2 shows panoramic images of the same row of PV modules in the four inspection periods. Dust concentration is a direct function of dry (December - March) and rainy periods (April to November) an image corresponding to the end of dry periods (march before clean-up) shows high dust concentration. After the cleaning process there is a slight deterioration in the modules' color as compared to the first inspection. According to Table 1, the identified failure mode is discoloration.
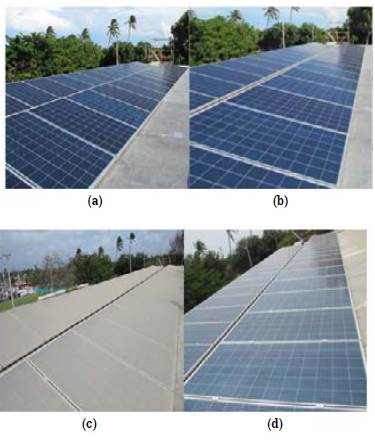
Figure 2 Panoramic images of the same row of PV modules in the four inspection periods: a. October 2018, b. January 2019, c. March 2019 (before clean up), d. March 2019 (after clean up)
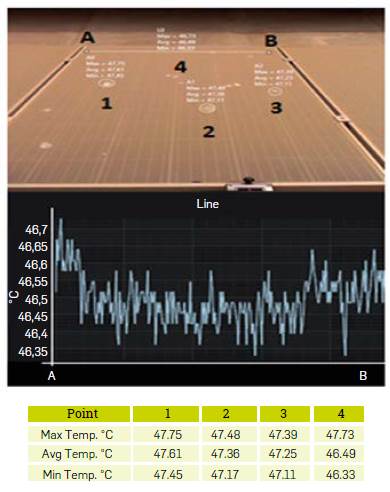
During the third inspection, a high level of dust content and a significant quantity of bird droppings were observed in the modules. A thermal analysis was performed to assess the module temperature performance; this analysis showed that the dust level maintains a homogeneous temperature on the surface, whose maximum value was 46.7 °C and minimum value was 46.35 °C, see Figure 3. Apparently, as the level of dirt increases, the modules temperature decreases; this phenomenon could be caused by the change in the amount of energy passing through the dirt layer.
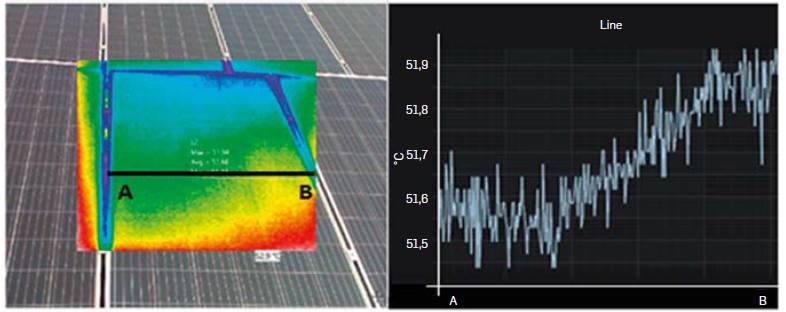
A thermal analysis was carried out after the cleaning process; such analysis showed that the modules temperature in the analyzed row varies by less than 1 °C. It was also noticed that discoloration has not generated changes in module temperature so far, see Figure 4.
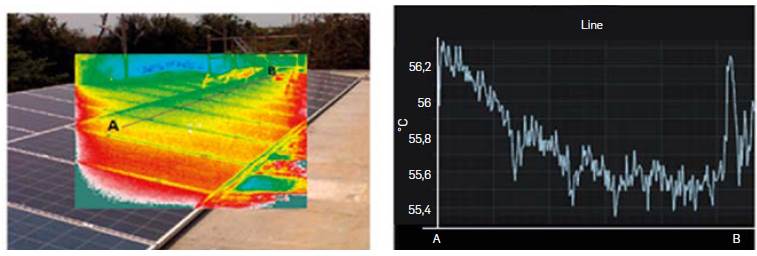
Figure 5 shows a discoloration between cells in the same PV module, A thermal analysis was carried out to assess the effect on module temperature; however, thermography indicated that the variation between these points did exceed 1 °C, see Figure 6.
SOLAR CONVERSION EFFICIENCY
To calculate the efficiency of a photovoltaic system, using a limited monitoring instrumentation, measurement of global irradiation (G g ), power (P) and energy generated (Ed) were applied on a photovoltaic system that had been accumulating dust for 9 months.
The global irradiance was initially monitored over 33 days, between February 17,2019, and March 21,2019. These analysis periods were chosen considering the low variance in the radiation at the same time during the day. The interval of global irradiance registered was between 529 w/m 2 and 585 w/m 2 . Nevertheless, the plane irradiation cannot be continuous. The main reason is that the direct irradiance sensor is portable and was designed to measure during shorts times per day, exposed to ambient conditions. A correction factor (F c ) was calculated to avoid higher instrumentation costs. This correction factor is necessary to obtain the value for G p (Equation 1) initially, a number of 10 samples from plane irradiation was used for different moments, during three days in a month, using a portable plane irradiance sensor.
On the other hand, the power and energy values were obtained from historical data of the inverter platform, SolarMan, seeking to calculate the efficiency in the system according to Equation 2.
Figure 7 shows the solar conversion efficiency changes after 33 days of dust accumulation on the surface of the photovoltaic modules. Hence, there is a substantial reduction in system efficiency. Although the design efficiency value is 15.32 %, the highest value, measured on the first day of analysis, was 10.91 %, and the lowest value was registered on day 26, as 8.65 %.
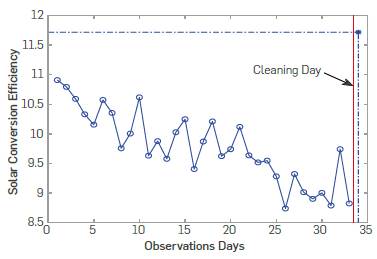
On day 34, a cleaning process was performed on the photovoltaics system to analyze efficiency behavior; this value was registered with a superior performance of (11.72 %) and a global irradiance of 570 W/m2, which means an increase of 2.98 %. This value is marked with an asterisk in Figure 7.
On the other hand, the energy generated per day during the study was in the range of 315.15 kWh to 644.1 kWh. These values were monitored using the SolarMan platform. In a normal day, the power production is not a constant value, but an equivalent power can be estimated knowing the value of the energy produced in one day, E d , with time t d , according to Figure 8.
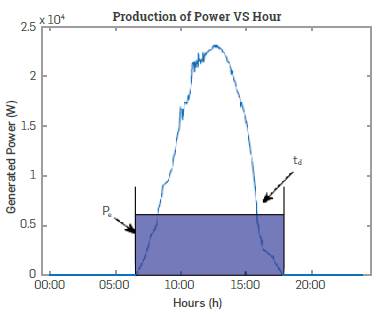
It means that there is a value for equivalent irradiance (4) considering a constant hourly radiation during the daym where the definition of efficiency is:
Where η M sc . is the efficiency before cleaning the photovoltaics module. From this equation, I e before cleaning is calculated:
Therefore, the equivalent power when the modules are clean (Pe c) can be calculated using the efficiency with clean modules (η C sc ).
By replacing Equation 6 in Equation 5, the following expression is obtained:
Consequently, can be reexpressed in terms of energy as follows:
Hence, the energy that was not generated (AE) because of soiling on the surface of the modules is defined as:
Based on this result, it is possible to calculate the revenue loss due to non-generated energy because of soiling in the panels. In this study, the opportunity cost is 0.1 USD/kWh. The total amount of non-generated energy was 3464 kWh, which represents a revenue loss of 346.4 USD/month.
The effect of the cell temperature, wind velocity, and relative humidity was also checked during the research. Six months of data were used to assess the effect of wind velocity, relative humidity, and cell temperature over panels energy production. The correlation analysis was conducted by such means Figure 9 shows the correlation matrix, with the last column including the correlation between power generated and cell temperature, relative humidity, and wind velocity. Here, "Pot" stands for power, "Tc" for cell temperature, "RH" for relative humidity, and "WS" for wind speed.
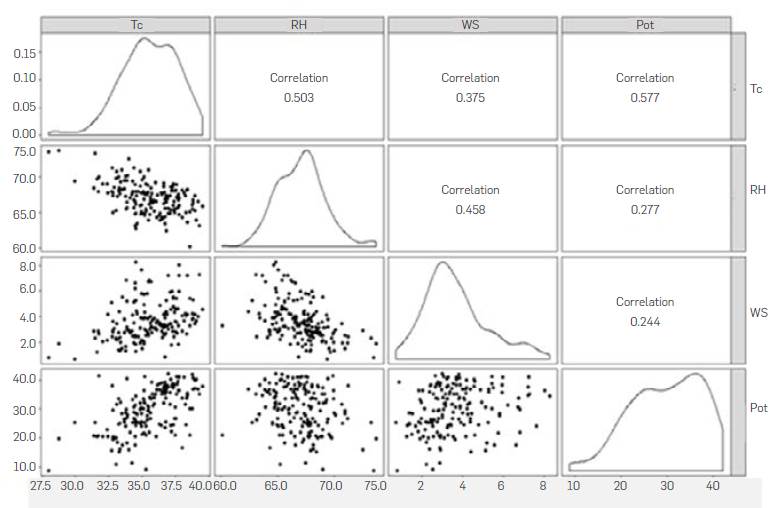
The three correlations in the last column of the matrix can be considered low, which implies that there is not a strong effect of those variables over the power generated. Also, a linear model (Equation 10) was fitted with the following equation
The coefficients were significant, and the statistical assumptions were met, but the R2 value was only 0.3292. It can be stated that even when the correlation between power and cell temperature is not minimal, the cell temperature fails at predicting power behavior. In other words, more variables are needed to describe the power.
Consequently, wind, relative humidity, and cell temperature were not considered in the final model.
STRUCTURE DEGRADATION
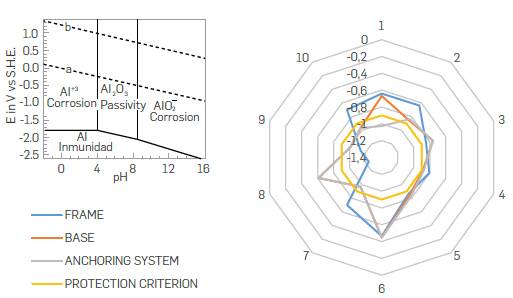
The galvanic series is the location of different types of materials with respect to their electrochemical potential. In the specific case of aluminum, potential measurements are obtained against a Cu/ CuSO4 electrode, allowing the identification of the tendency of corrosion, immunity or passivation of the material relative to the pH of the surrounding environment [22]. According to the cathodic protection criteria of the NACE RP 0169 standard, the aluminum metal structure is protected with more negative potentials of -0.9 volts [23]. Figure 10 presents the potential measurements for the selected panels showing active corrosion processes, which is favored with the pH range between 4-8. This shows the formation of a protective layer of Al2O3. For the particular case of residues gathered in the selected points, the average pH measured was 7.06; therefore, the formation of passivating film is stable.
The atmospheric characterization is carried out in the presence of relative humidity greater than 70 %, which facilitates the condensation on metal surfaces, promoting the formation of a wet film that may contain contaminants such as chlorides and sulfides that accelerate the corrosion process [25]. Figure 11 shows the reports of the concentration of chlorides and sulphides identified through physicochemical tests of residues found on the aluminum surface.
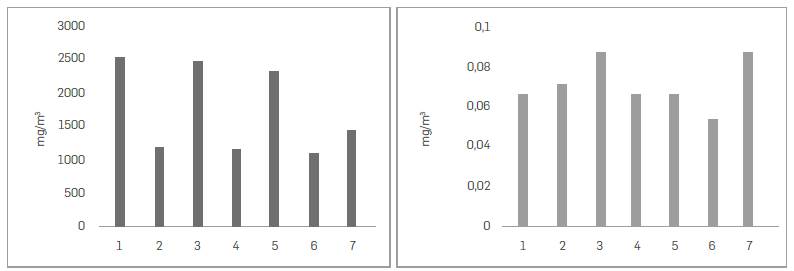
Figure 11 (a) Chlorides concentration (mg/m3); (b) Sulphides concentration (mg/m3) material taken from the surface of photovoltaic panels
According to ISO 9223 [26], it is possible to categorize outdoor atmospheric corrosivity into 5 levels: very low (C1), low (C2), medium (C3), high (C4) and very high (C5) according to the content of SO2 and chloride type contamination [27, 28]. Given the results of the dust samples obtained, the sulfide concentration exceeded 30 pm/m3 and levels up to 2500 mg/m3, placing it in a high corrosivity category (C4). With this information, it is then estimated that the degradation of the aluminum structures of the photovoltaic panels is generated by the loss of mass between 2-5 mg/m2 year assuming uniform corrosion, which must be frequently evaluated to identify localized corrosion faults.
CONCLUSIONS AND FUTURE WORK
An evaluation of performance and early degradation of a 180.8 kWp rooftop on a grid- connected photovoltaic system is presented. The proposed approach includes carrying out visual inspections over the system and estimating the solar conversion efficiency of the entire system. The studied system is installed in a tropical environment with strong influence of particulate matter and high salinity. It was switched on in June 2018, and the performance assessment and early degradation began in October 2018.
The early degradation analysis suggests discoloration as the most common failure mode. However, according to Figures 5 and 6, at this time, there is not a substantial contribution of this failure mode on module temperature. This phenomenon could cause a problem if there would be a loss of adhesion between the encapsulating polymeric and the cells of the module, causing penetration of water within it. There are no failure modes such as delamination, corrosion in solder bond, in any of the inspected modules, which is reasonable, because these failure modes should appear after three years of operation according to climatic conditions [18]. Cracking of solar cell and glass breakage were not identified either; these are into likely due to the location of the panels (rooftop) and no maintenance activities heretofore.
The performance assessment of the solar PV system shows a reduction in the overall system efficiency, considering a design efficiency of 15.3 %. On the day before the cleaning process, the efficiency was 8.65 %, which is lower than the design efficiency. This reduction is caused by the high dust concentration during dry periods. After the cleaning process, the solar conversion efficiency increased by 2.98 %, reaching a value of 11.72 % energy conversion. There was an early performance degradation rate of 0.05 %/day during the highest dirt concentration days.