


 English (pdf)
 Article in xml format
 Article references
 Send this article by e-mail
 Cited by SciELO
  Cited by Google
  Similars in
SciELO
Similars in
SciELO  Similars in Google
 Permalink
1. INTRODUCTION
Reducing sugars produced from agro-industrial wastes using hydrolysis represent a promising alternative of chemicals and energy [1]. It is well known that cellulose and hemicellulose fractions in waste biomass can be hydrolyzed to hexoses and siloxes, which in turn can be considered chemical synthesis building blocks, through several processes that mainly involve a physical, chemical, physic-chemical or biological pretreatment, followed by the addition of acid, basic or enzymatic catalyst [2]. In this regard, agro-industrial wastes from food crops and vegetables outer shells is commonly discarded and sent to sanitary landfills without further valorization Wastes generated in produce markets in Colombia are comprised mainly of pea pot and corn stover residues, because both are sold preferably in a consumer-friendly presentation without shells. Due to the presence of free sugars, as well as cellulose and hemicellulose fractions, and the large amounts generated each day that constitute mainly a waste management problem, pea pot, and corn stover are readily available as a raw material for sugars production [3], [4] While several studies have focused on the production of sugarfrom corn stover [5], pea pot hydrolysis, even by conventional base and acid catalyzed methods, has been scarcely studied. Therefore, in this study the experimental results of batch and semicontinuous subcritical water hydrolysis of pea pot and corn stover wastes are reported and the effect of operation mode and process variables in reducing sugars yield is discussed.
2. THEORICAL FRAMEWORK
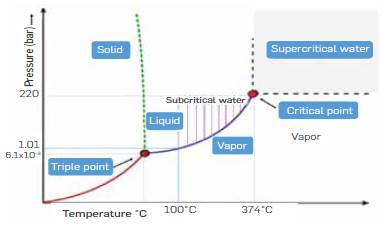
In recent years, hydrolysis carried out at sub and supercritical water conditions has emerged as a promising alternative to acid and enzymatic hydrolysis [6], Figure 1 shows the phase diagram of water in which subcritical and supercritical water regions are indicated The technology takes advantage of the well-known tunable properties of water In the vicinity or above the supercritical point (374 °C) to favor or disfavor acid/basic catalysis [7], At the same time, sub/supercritical water can easily penetrate the lignocellulosic matrix due to its low viscosity and high diffusivity, whereas its low dielectric constant enhances the solubility of organic compounds [8], Regarding sugars production by subcritical and supercritical water, hydrolysis is less aggressive than conventional methods such as acid and alkali hydrolysis because they degrade less sugar and do not generate solid waste. Compared to enzymatic hydrolysis, the advantage is the high cellulose hydrolysis rate [9].
3. STATE OF THE TECHNIQUE
Several subcritical and supercritical water hydrolysis studies have been conducted in batch, semi-continuous, and continuous mode operation with different LignoceLLuLosic residues, as reviewed in detail by [6]. In batch mode, biomass and water are loaded simultaneously to the reactor in a specific weight ratio in which water is in excess, heated up, and left to react for a specific time. Since no product is removed during the reaction, produced sugars could be easily degraded. In semicontinuous mode operation, a fixed amount of lignocellulosic biomass is packed to the reactor and water flows continuously, removing reaction products to avoid degradation [7], This mode of operation has received the most attention, mainly in lab- scale studies, due to the difficulties that could arise from pumping a biomass slurry at sub/supercritical conditions in continuous mode operation. Batch and semicontinuous experiments are usually carried out in the temperature range 180 °C to 300 °C. Accordingly, in this work we report on the production of total reducing sugars by lab- scale batch and semicontinuous subcritical water hydrolysis of pea pot and corn stover, to establish the process conditions in each reactor set-up that allow obtaining high reducing sugars yields and the effect of the studied main factors and its interactions in each process.
AGROINDUSTRIAL WASTES
Pea pot (Pisum sativum L.) and corn stover (Zea mays L.) wastes were collected in Paloquemao Produce Market In the city of Bogotá Colombia. Both residues were separately comminuted in a knife mill and sieved below 400 μm. Comminuted samples were stored in a freezer without any other pre-treatment. Cellulose, hemicellulose and lignin composition of pea pot, corn stover, sugarcane bagasse and rice bran are shown in Table 1 for comparison purposes. Sugar cane bagasse hydrolysis by conventional as well as emerging methods has been extensively reported in literature [10], [11] which can be attributed to the high cellulose and relatively low lignin contents when compared to other lignocellulosic materials. Lignin is an especially problematic component of agricultural residues [10] as decomposition of lignin produces phenolic compounds, which strongly inhibit the action of yeast [12].
EXPERIMENTAL SET-UP
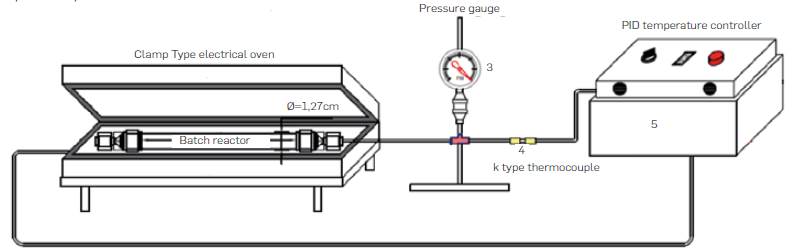
Experiments were carried out in batch and semicontinuous lab-scale experimental set-ups. Batch reactor equipment is shown in Figure 2. It consisted of a tubular reactor, a 3 kW insulated electrical clamp-type oven, and a PID temperature controller. K type thermocuples were used to measure the temperature inside the reactor and near the walls of the oven as shown in Figure 2. The reactor was made of 316SS Swagelok tubing and screw caps. Reactor dimensions were 0.5 in OD (1.27 cm), 0.065 in (0.17 cm) wall thickness wall thickness, length of 10 cm, and volume of 6.94 cm3. In batch experiments, fixed amounts of comminuted biomass and water were loaded to the reactor. Volume of added water was calculated according to the mass ratio for a specific run and the expected water pressure generated at reaction conditions calculated through steam tabs. Then the reactor was placed in the electrical insulated oven previously heated to the desired reaction temperature. Heating time to the desired reaction temperature from room temperature took less than 5 min and reaction time was counted from that moment. Upon completion of reaction time, reactor was removed from the oven and cool down rapidly in a water bath, unscrewed and emptied up in a sample collection flask.
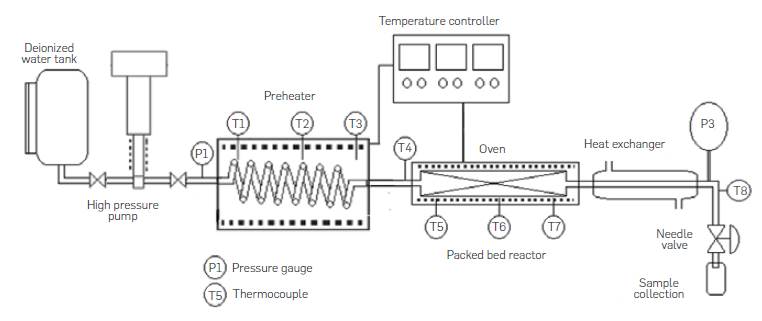
The semicontinuous lab-scale unit consisted of a deionized water tank, a Williams Milton Roy pneumatic high pressure pump model CP250V225, a preheater made of 316SS Swagelok tubing 1/8 in OD (3.175 mm), length of 3 m coiled tubing and electrical resistances, an insulated tubular reactor made of 316SS Swagelok tubing 0.5 in OD (1.27 cm), 0.065 in (0.17 cm) wall thickness with a length of 10 cm, a concentric tube heat exchanger with water as cooling media, a needle depressurization valve and sample collection recipient, pressure gauges and thermocouples, as shown in Figure 3. In a typical run, the reactor is removed from the system and packed with a fixed amount of comminuted agro-industrial waste. Glass beads are also added to the reactor to avoid biomass compaction and plugging. Once the reactor was put back in place the system is pressurized with water at room temperature up to 2000 psi to avoid water phase change during the heating up period at subcritical water hydrolysis conditions. Hot water does not come into contact with biomass in the reactor until the reaction temperature is reached. Once the temperature in the preheater is constant, pumping is started and pressure is adjusted through the needle valve. Samples are collected in sample tubes every 2 minutes. Pneumatic pump frequency and piston length were adjusted to have deionized water flowrates of up to 12 mL/min.
ANALYTICAL METHODS
Total Reducing sugars (TRS) concentration was measured in reactor effluent samples by the dinitrosalicylic (DNS) colorimetrie method using D-glucose as standard [17]. For each ml of hydrolysatesample: 1 ml DNS reagent previously prepared was added, boiled for 15 min and 1 ml deionized water added afterward to keep for 10 min in cold water before reading the absorbance in a Macherey-Nagel Nanocolor 500 D photometer at 540 nm. The concentration of reducing sugars was calculated based on a standard curve obtained with standard D-glucose concentrations of up to 1 mg/ml,
EXPERIMENTAL DESIGN AND STATISTICAL ANALYSIS
Experimental study of batch subcritical water hydrolysis of pea pot wastes was carried out according to a 24 experimental design with the factors Temperature (A), Time (B), pressure (C) and water to biomass mass ratio (D). Experimental range for each factor was based on previous batch hydrolysis experiments of kikuyu grass residues, in which a maximum yield of total reducing sugars of 8.5 % was measured at 30°C, 30 min reaction time, 30:1 water to biomass ratio and 3190 psi [7]. Acccordingly, low and high levels for each factor were set as 250-300 °C, 15-30 min, 3190-3650 psi, and 6:1-30:1, respectively. Each experimental run was replicated and four repetitions were carried out in the central point. The full design was comprised of 36 experimental runs made in randomized order. For each run, mass of water loaded to the reactor, required to generate the desired pressure at reaction conditions, was estimated by means of density of water at subcritical conditions in steam tabs (Kg/m3) and reactor volume (m3). Required biomass was estimated from water to biomass ratio according to the experimental design In each sample concentration was determined and TRS mass was estimated with the volume of water loaded. TRS yield was the ratio of average TRS mass for a specific run and total pea pot mass loaded to the reactor. Statistical analysis of the results was made according to the analysis of variance (ANOVA), as well as the graphical analysis of the significant main effects and interactions plots, by using the statistical software package Minitab 16®.
Semicontinuous subcritical water hydrolysis of corn stover agroindustrial wastes was carried out according to a 23 experimental design with the factors Temperature (A), Pressure (B), and water flowrate (mL/min). Low and high levels for each factor were 240290 °C, 1500-2000 psi, and 9-12 mL/min, respectively. Experimental range for each factor was based on previous semicontinuous hydrolysis experiments of kikuyu grass residues, in which a maximum yield of accumulated total reducing sugars of 22 % was measured at 300 °C, 2000 psi and water flowrate of 9 ml/ min [7], As was previously indicated, a fixed amount of corn stover biomass was packed to the reactor, whereas water flow was kept constant. Reactor effluent samples were taken every 2 minutes in glass tubes. Total reducing sugars mass produced was determined with the volume of collected samples in each tube and measured total reducing sugars concentration. Accumulated TRS mass per experimental run was estimated by adding up TRS mass obtained in each sample. TRS yield was calculated as the ratio of accumulated TRS mass per experimental run to total corn stover biomass packed to the reactor.
PEA POT BATCH SUBCRITICAL WATER HYDROLYSIS
Table 2 summarizes experimental reaction conditions, TRS concentration obtained for each replicated run, and average TRS yield.
Table 2 Pea pot batch hydrolysis reaction conditions and TRS concentration
| Run | Temperature (°C) | Time (min) | Pressure (psi) | water/biomass mass ratio | TRS concentration (mg/mL) | TRS concentration (mg/mL) |
|---|---|---|---|---|---|---|
| 1 | 250 | 15 | 3190 | 6 | 19.6 18.6 | 9.5 |
| a | 300 | 15 | 3190 | 6 | 23.8 22.2 | 11.8 |
| b | 250 | 30 | 3190 | 6 | 22.4 24.0 | 11.9 |
| ab | 300 | 30 | 3190 | 6 | 20.6 25.3 | 11.8 |
| c | 250 | 15 | 3650 | 6 | 5.1 3.5 | 11 |
| ac | 300 | 15 | 3650 | 6 | 7.9 8.0 | 21.8 |
| be | 250 | 30 | 3650 | 6 | 2.7 5.1 | 9.8 |
| abc | 300 | 30 | 3650 | 6 | 8.5 7.3 | 21.8 |
| d | 250 | 15 | 3190 | 30 | 10.8 10.8 | 4.48 |
| ad | 300 | 15 | 3190 | 30 | 7.8 8.8 | 3 |
| bd | 250 | 30 | 3190 | 30 | 26.5 21.3 | 12.4 |
| abd | 300 | 30 | 3190 | 30 | 7.8 7.3 | 2.5 |
| cd | 250 | 15 | 3650 | 30 | 5.8 7.2 | 17.5 |
| acd | 300 | 15 | 3650 | 30 | 4.1 4.2 | 10.4 |
| bed | 250 | 30 | 3650 | 30 | 6.4 8.3 | 20 |
| abed | 300 | 30 | 3650 | 30 | 3.9 3.9 | 9.6 |
| 0 | 275 | 22.5 | 3420 | 18 | 15.6 18.2 | 15.8 |
| 16.6 20.85 |
Experimental data in Table 2 show reproducibility was generally good in all of the replicated experimental runs. Highest TRS yield was 21.8% and was obtained when working at 300 °C, 15 min reaction time, 3650 psi a 6:1 biomass to water ratio. Performed ANOVA analysis is summarized in Table 3 and indicates factors time (B) and water to biomass mass ratio (D) as well as second order nteractions temperature-time (AB), and time-mass ratio (BD) had a significant effect on the response with a significance level of 95% (P-value < 0.05), while pressure (C) had no effect (P-value > 0.05) According to [18], the main effects do not have much meaning when there are involved significant interactions. Figure 4 shows the graphical analysis of temperature-time (AB) and time-mass ratio (BD) second order interactions performed in Minitab®.
Table 3 ANOVA for batch subcritical water hydrolysis experiments
| Term | Effect | Coef | SE Coef | T-value | P-value |
|---|---|---|---|---|---|
| Temperature (A) | -0,462 | -0,231 | 0,4742 | -0,49 | 0,630 |
| Time (B) | -3,720 | -1,860 | 0,4742 | -3,92 | 0,001 |
| Ratio (D) | 6,826 | 3,413 | 0,4742 | 7,20 | 0,000 |
| AB | -6,724 | -3,362 | 0,4742 | -7,09 | 0,000 |
| BD | 1,955 | 0,977 | 0,4742 | 2,06 | 0,050 |
| ABD | -3,347 | -1,674 | 0,4742 | -3,53 | 0,002 |
| S = 2,68262 | PRESS = 294,767 | ||||
| R-sq. = 84,31% R-sq.(pred.) = 74,30% R-sq.(adj) = 80,55% | |||||
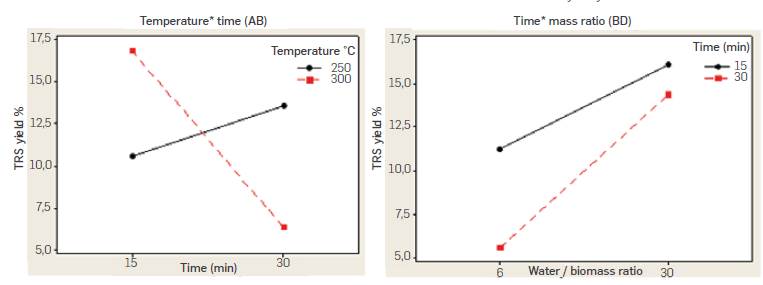
Figure 4 Temperature-time (AB) and time-mass ratio (BD) interactions for pea-pot batch subcritical water hydrolysis experiments
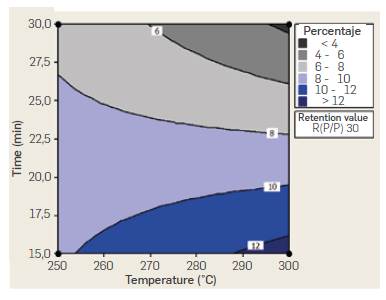
While the positive effect estimated for B factor in ANOVA analysis suggests working at a high level (30 min) of reaction time to increase TRS yield, AB interaction indicates the opposite trend. While yield ncreases with reaction time when working at 250 °C, it decreases sharply with time when working at 300 °C. The reduced yield observed with time when working at 300 °C could be attributed to decomposition reactions of produced sugars due to the higher temperature and prolonged reaction time. AB interaction suggests higher yields can be obtained at 300 °C and 15 min reaction time, A similar conclussion can be withdrawn from the Temperature-time interaction (AB) contour plot for a fixed 30 mass ratio shown in Figure 5. Percentaje yields higher than 12 % are obtained at temperatures of 300 °C and 15 min reaction time.
On the other hand, BD interaction indicates higher TRS yields are obtained with a 1:30 biomass water mass ratio and 15 min reaction time. While the maximum yield measured in experiments was obtained with a 6:1 mass ratio and 3650 psi, analysis of interactions suggests working at shorter residence times (15 min), a 30:1 water to biomass ratio and lower pressure (3190 psi) leads to higher TRS yields. Similar results were reported by Maravic et al., [19] in the batch subcritical water hydrolysis of sugar beet pulp. Yields in the range 7.18% to 15.84% were obtained, with the maximum yield at the lowest temperature of 150 °C and 35 min. Temperature showed the strongest impact in hydrolysis yield with a negative effect as a result of excessive degradation at higher temperatures.
CORN STOVER SEMICONTINUOS SUBCRITICAL WATER HYDROLYSIS
Aspect of effluent samples collected varied widely with time, as shown in Figure 6 for experimental run carried out at 290 °C, 1500 psi and 9 mL/min. This observation is consistent with the transient nature of subcritical water hydrolysis. When water flow through the reactor is initiated, biomass is being heated up to the desired reaction temperature, and collected effluent samples are mostly clear. At temperatures around 200 °C, biomass hydrolysis reaction speeds up, collected samples are darker in aspect and abundant foam is formed. Later, effluent samples became clear again, which ndicated biomass hydrolysis slowed because biomass has been depleted in the reactor, indicating the end of the experimental run. A darker brown color in reactor effluent samples could be associated to a higher concentration of reducing sugars as measured by means of DNS colorimetrie method
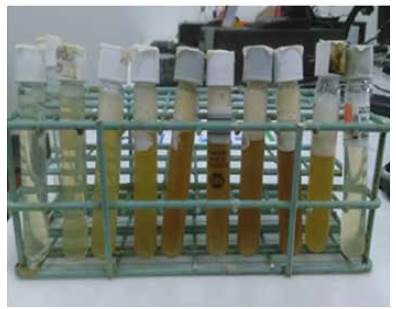
Figure 6 Aspect of effluent samples for experimental run carried out at 290 °C, 1500 psi and 9 mL/min
Figure 7 shows accumulated TRS yield (TRS g/100 g packed biomass) for experimental runs carried out with a water flow rate of 9 mL/min. At 240 °C, accumulated TRS yield was 3 g/100g, whereas at 290 °C a TRS yield of 19 g/100 g biomass was estimated.
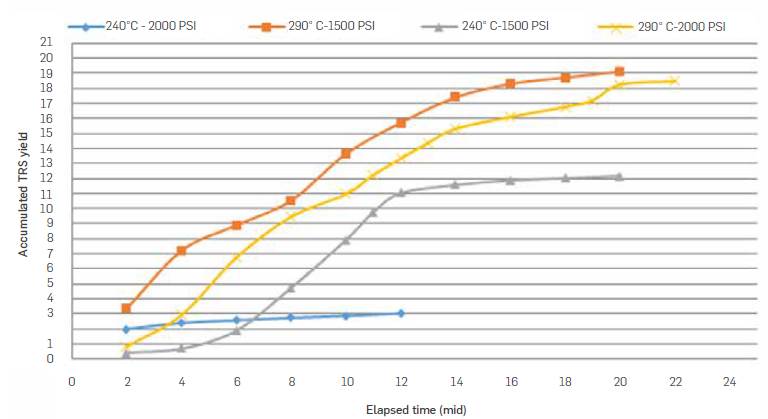
Table 4 summarizes semicontinuous subcritical water hydrolysis reaction conditions and accumulated TRS produced. Highest TRS yield was 19.1 g/100g biomass and was obtained when working at 290 °C, 9 mL/min and 1500 psi.
Table 4 Semicontinuous hydrolysis reaction conditions and accumulated TRS produced
| Run | Temperature (°C) | Pressure (psi) | Flowrate (ml/min) | Accumulated TRS g/100g biomass |
|---|---|---|---|---|
| 1 | 240 | 1500 | 9 | 12.17 |
| a | 290 | 1500 | 9 | 19.1 |
| b | 240 | 2000 | 9 | 3.04 |
| ab | 290 | 2000 | 9 | 18.45 |
| c | 240 | 1500 | 12 | 12.97 |
| ac | 290 | 1500 | 12 | 11.85 |
| be | 240 | 2000 | 12 | 9.19 |
| abc | 290 | 2000 | 12 | 15.73 |
Performed ANOVA is shown in Table 5 and indicates Temperature (A) and its interactions with pressure (AB) and water flow rate (AC) had a relevant effect on the TRS yields (P-value< 0.05). The analysis of significant interactions is shown in Figure 8.
Table 5 ANOVA for semicontinuos hydrolysis experiments
| Run | DF | Adj SS | Adj MS | F-value | P-value |
|---|---|---|---|---|---|
| Temperature (A) | 1 | 96.327 | 96.3272 | 1146.07 | 0.019 |
| Pressure (B) | 1 | 11.713 | 11.7128 | 139.36 | 0,054 |
| Water flowrate (C) | 1 | 1.140 | 1.14 | 13.56 | 0,169 |
| AB | 1 | 32.562 | 32.5624 | 387.42 | 0.032 |
| AC | 1 | 35.786 | 35.7858 | 425.77 | 0,031 |
| BC | 1 | 12.202 | 12.2018 | 145.17 | 0,053 |
| Error | 1 | 0.084 | 0.0841 | ||
| Total | 7 | 189.814 |
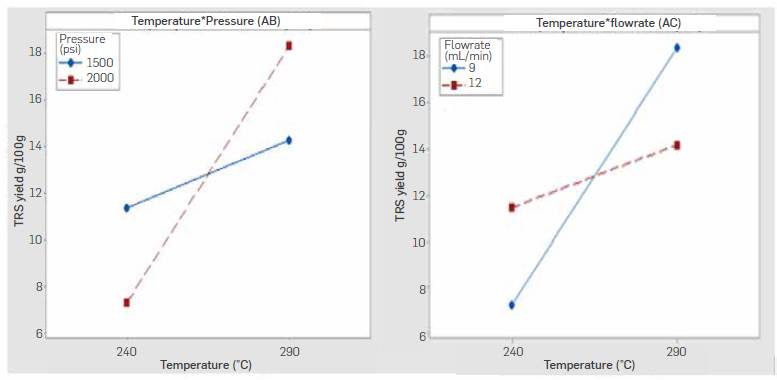
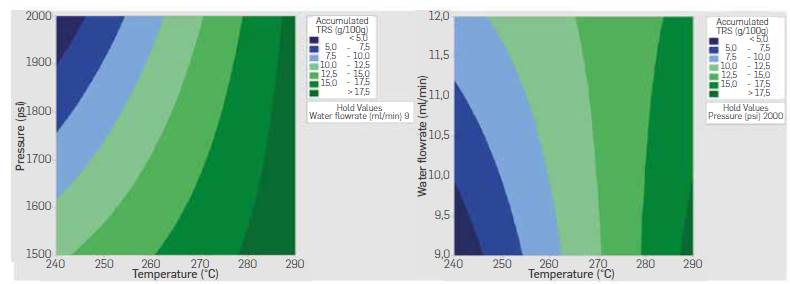
Temperature-pressure interaction indicates higherTRS yields were obtained when working at a high level of temperature (290 °C) and pressure (2000 psi) whereas temperature-flowrate interaction indicates higheryieldsat a high level of temperature (290 °C) and low Level of flowrate (9 mL/min). Both interactions agree in the positive effect of temperature on yield. These results suggest a higher temperature speeds up the hydrolysis reaction even when working with longer residence times, and that produced TRS sugars were not prone to decomposition as a result of the increased temperature and the longer residence time in the reactor. Temperature-pressure and temperature-flowrate contour plots are shown in Figure 9. Higher yields are expected following the direction of temperature above 290 °C and pressures around 2000 psi, while a reduced flowrate at high temperature also leads to a high TRS yields.
Although subcritical water hydrolysis of corn stover by batch and semi-continuous mode operation has been the focus of several publications, a comparison with the obtained results is not straightforward, since most studies have explored the use of subcritical water and its effect in the achievable liquefaction degree, enzyme digestibility and sugars concentration in the hydrolysate in the temperature range 180-220 °C [13], [20]. Alternatively, [5] reported a 20.81% glucose and xylose yield at 170 °C, 30 MPA, and 90 min in batch subcritical water hydrolysis of corn stover. The reported sugars yield, at a temperature that avoids degradation, was similar to the maximum yield of 19% obtained at 290 °C, 1500 psi, and 9 ml/min. Similar TRS yields have been reported for semicontinuous subcritical water experimental studies of different raw materials. For example, Abaide et al., [21] reported a 33.6% TRS yield on a dry basis (24% wet basis) for rice straw, which consisted of 22.4% cellulose, 24.6 % hemicellulose and 9 % moisture at 220 °C, liquid to solid ratio of 7.5 and 15 min of operation whereas Santos et al. [22] reported 26.5% and 27.1% yields at 220 °C from pecan husks and shells and 26.3% for pecan leaves and stacks at 260 °C. Similarly, a 22% TRS yield was reported for the semicontinuous subcritical water hydrolysis of kikuyu grass biomasses at 300 °C and 2000 psi. As it was previously mentioned, maximum TRS yield obtained from different biomasses will depend not only on the biomass cellulose, hemicellulose and lignin composition, but also on any sample conditioning such as size reduction and moisture removal.
CONCLUSIONS
Batch and semicontinuous hydrolysis of agro-industrial pea pot and corn stover wastes were conducted in order to assess the effect of operating conditions in the yield of total reducing sugars obtained. A maximum yield of 21.8 % was obtained in the batch subcritical water hydrolysis of pea pot at 300 °C, 15 minutes reaction time, the pressure of 3650 psi, and a 6:1 water to biomass mass ratio. Performed ANOVA analysis indicated factors time (B), biomass to water mass ratio (D), second-order interactions temperature-time (AB), and time-mass ratio (BD) had a significant effect on the response, despite the pressure had no significant effect. The analysis of second-order interactions suggests the optimal set of operating conditions should be 300 °C, 15 min of residence time, a 30:1 water to biomass ratio, and lower pressure (3190 psi). A maximum accumulated TRS mass of 19.1 g per 100 g biomass was obtained in the semicontinuous subcritical hydrolysis of corn stover when working at 290 °C, 9 mL/min, and 1500 psi.
Thus, ANOVA showed the interactions between temperature (A) and pressure (AB) and water flow rate (AC) had a significant effect on the response (TRS). That could be attributed to an increased hydrolysis reaction rate at higher temperatures. We observed that higher temperature speeds up the hydrolysis reaction, even when working with longer residence times. The TRS produced by the semicontinuous operation were not prone to decomposition when the temperature and the residence time in the reactor were increasing. However, batch experiments showed contrary behaviour when the reaction time was exceeded, resulting in lower yields. Effect of process variables for both modes of operation and obtained TRS yields agree well with those obtained from biomasses with similar cellulose and hemicellulose composition. Slight differences in temperatures and times might be attributed to the composition of raw materias as well as any pretreatment applied such as size reduction or moisture removal prior to the experiments.
The approach of this study showed the feasibility of producing reducing sugars from agro-industrial wastes through subcritical hydrolysis either by batch or semicontinuous mode operation at temperatures around 300 °C. This processing technology could be applied to different types of raw materials, even those on a aqueous base such as algae biomasses or to complex produce market wastes. Although pea pot and corn stover were studied separately, optimal temperatures and reaction times suggest a set of operating conditions such as those determined could be applied to mixed biomasses. This work allowed us to recognize the great possibility to give added value to agro-industrial waste and obtain a future sustainable source for biofuel generation.

