


 English (pdf)
 Article in xml format
 Article references
 Send this article by e-mail
 Cited by SciELO
  Cited by Google
  Similars in
SciELO
Similars in
SciELO  Similars in Google
 Permalink
1. INTRODUCTION
Nowadays, the global energy system is characterized by a high use of fossil fuels for power generation. By the end of 2019, fossil fuels accounted for 72.7% of the world's electricity generation, while all renewable sources, including hydro and nuclear, as a whole, only accounted for 27.3% [1]. An alternative to overcome the gap created by fossil fuels, achieve energy security and address climate change is the use of renewables, which by its origin should be decentralized or distributed, that is to say, electricity is generated in points near the place of consumption and with locally available resources. Decentralized Energy (DE) has a higher degree of resilience than fossil fuels, and it is reliable, efficient, environmentally friendly, affordable, and accessible, as well as contributing to energy security [2]. Through the use of DE, a greater electrical coverage to rural or distant populations can be reached [3], available resources are used, and less money is invested in energy transmission.
With respect to Mexico, in early 2017, part of the subsidy for fossil fuels, gas and electricity became eliminated, resulting in increases of up to 20% for fossil fuels and gas, and up to 4.5% for electricity. While this affected the economy of most of the Mexican population, it may also represent a boost for the expansion of renewable energy projects. According to Yaqoot et al., [4], the financial appeal of decentralized renewable energy projects improves with the removal of fossil fuel-based energy subsidies. That might mean a significant opportunity for the development of sustainable energy projects in Mexico given the country's excellent renewable resources [5]. In Mexico, it is possible to install up to 5,000 GW with solar energy [6], [7]. Moreover, the northern coastal zone of the Gulf of Mexico has a potential of up to 6.7 kWh/m2 [8]. Regarding wind energy, Mexico has the potential to install between 40 and 50 GW through this technology [6], [7], [9]. There are also areas where it is possible to generate up to 15,000 kW per installed turbine per year [10]. Biomass has the potential to generate up to 167.9 TWh/year [11].
As regards the use of renewable resources in Mexico, most of the energy portfolio planning initiatives have focused more on the analysis of technical, economic, and environmental (greenhouse gas emissions) aspects, leaving social issues aside. Consequently, in those cases where projects have been developed, certain social [12] and environmental issues have been ignored. Some of the main social and environmental issues associated with power projects from renewable sources are: noise, landscape disturbance, loss of traditional economic activities, conflicts between community members due to economic inequalities, land dispossession, very low lease land payments, increase in rates of marginality, control, and pollution of natural resources by companies, as well as shortages and rising food prices [13]-[18].
In this paper, we developed an innovative methodology to assess the suitability of power generation through solar, wind, and biomass energy. Unlike most studies found in scientific literature [20]-[26], this work considers social, environmental, and economic conditions as key aspects to determine the suitability of renewable energy projects. As a case study, we will focus on an evaluation in Mexico. To do so, first, we will carry out a comprehensive analysis on social acceptance and resilience towards renewable energy, institutional capacities to support green technologies, and the conditions for hosting communities to benefit from these projects. Then, we will assess the availability and potential of renewable energy sources, and the location (states) with the best resources for power generation in Mexico. Based on the assumption that communities with the best performance in social, economic, and environmental aspects can better adapt and be more resilient to energy projects, and offer more favorable conditions to become beneficiaries of renewable technologies, we will develop a set of indicators linked to the three sustainability pillars to assess the places with the best renewable resources in the country. It will also be considered the life cycle and capacity factor of each technology. Finally, we will design a mathematical optimization model. The objective of this paper is to establish the most suitable locations for power generation, as well as the most reliable renewable technologies (solar, wind, and biomass), in social, environmental, and economic terms. This comprehensive analysis will provide a better understanding of the aspects behind the installation of renewable projects to achieve sustainable energy production.
2. IMPORTANT FACTORS IN THE ADAPTATION, RESILIENCE, AND ACCEPTANCE OF COMMUNITIES REGARDING RENEWABLE ENERGY PROJECTS
This concise introductory preamble is aimed at strengthening the theoretical background and obtaining better understanding of the term "resilience" means hereunder. There are numerous definitions of resilience, such as those in the review conducted by Koliou & van de Lindt [19]; however, we will consider the definition made by Arbon et al. [20] which states that there is resilience when the members of a community are inter-connected and work together thus being able to work and sustain critical systems under stress conditions, adapt to changes in the physical, social or economic spheres, and learn from experience to improve over time. According to Uriarte [21], the term resilience can be grouped under three categories: stability, recovery, and transformation. In this paper, we will rely on the transformation category, whereas people can resist and protect their integrity despite threats, emerging strengthened and positively transformed by experience. This category also includes regeneration, social reorganization, and new opportunities processes. This approach emphasizes people's capacity to adapt to change, learning, creativity, orientation towards the future, strengths, and opportunities [21]. Community resilience must meet the following principles: a) cohesive social structure -less inequality, inclusion, social participation, collaboration- ; b) government honesty, government legitimacy, government transparency, accountability, justice, and fairness; c) cultural identity, -sense of belonging-, d) collective self-esteem -pride on the place of residence- [21]. In a resilient community, there are neither isolated principles nor mechanical connections between these principles, so they must all be promoted in a comprehensive way to achieve resilience.
Sherrieb et al. [22] analyze a series of capacities for community resilience, namely: a) economic development -the level of equality in the distribution of resources, and the scale of diversity in economic resources (highlighting indicators such as infant mortality rate, life expectancy, literacy, safe water access, access to telephones, and cars, steel and energy consumption, and exports/imports)-, b) social capital -adaptive capacities that can support the process of community resilience to maintain and sustain community health (involving social support, social participation, and community bonds)-.
Scientific literature also highlights the importance of government and institutions promoting and guiding community resilience [23], [24]; however, in this work we have opted for a broader approach to the term "institutions", focusing on their important role in the processes behind the acceptance and implementation of renewable energy. In that sense, "institutions" refer to patterns of thinking and behavior of social actors, which are mutually reinforcing and structured in formal and informal rules, norms and procedures [25], [26]; in turn, they are in charge of relating the organization of community and society [27] norms and agreements. Ideas and thought patterns are repeated, assigning them similar meanings hence they become "institutionalized" [26] over time and become rules that govern social coexistence, including morale and behavior. These standards are not necessarily efficient, for example supporting acceptance of renewable energy, and can seem reluctant to change and innovation. Innovation requires institutional changes -structured markets, new fiscal systems, education systems, spatial planning processes, energy governance frames, etc. [25]-, strategic governance at various socio-political levels, and, more importantly, it demands the willingness to change rules and procedures to allow the development and implementation of new views, approaches, techniques and practices [28]. When the capacity for institutional change is low and willingness is poor, there will be a lack of trust among the actors involved in the development of new infrastructure, which requires knowledge of the social and geographical conditions that promote open policy and decision-making processes to key stakeholders [28], [29].
One of the main constraints of institutional change is mistrust among the different actors involved in the implementation of renewable energy projects. On the other hand, the fairer and more inclusive participatory processes, especially in the early stages of decision-making, as well as social impact assessments, can facilitate institutional change, thereby social acceptance, and ultimately, the success of renewable projects [25], [28], [30]-[32].
Although renewable energy sources represent a good alternative for power generation, when compared with fossil fuels, as mentioned in the Introduction herein, there are certain problems, especially of a social nature, resulting from the start-up of power generation plants. For the installation of renewable projects, certain factors must be considered to ensure their proper integration in the communities. There must be social and environmental resilience so that the villagers are benefited and not harmed by this type of facility. Some authors highlight the importance of the socio-economic conditions of the communities in the adaptation and sustainability of renewable energy projects. In this context, Urmee and Md [33] emphasize that to achieve sustainability in the socio-cultural aspect of renewable energy projects, the residents must be involved and participate, among other factors. They also stress that the level of participation of communities depends on their context -economic conditions, religious traditions, educational level, health, nutritional status, political economy, land arrangements, government structures, and effectiveness, among others-. Finally, they conclude that despite the success of renewable generation, projects depend on the technological aspects and financial instruments, and the sociocultural and political aspects are no less important. Moreover, according to Camagni et al., [34] in a sustainable city, the services of clean potable water, sanitary facilities, and solid waste collection must be equally provided everywhere, in other words, a "good city" is one with an efficient distribution of goods and services and provides environmental equity. Hence, an increase in income levels, improvement in housing, basic social services, education levels, and organizational capacity are reflected in the progress of environmental conditions in Third World countries [34]. Social conditions are a fundamental aspect for the proper integration of renewable projects in the communities [35] therefore if the inhabitants of a state or city do not have the adequate social conditions, there will hardly be sustainability in the renewable projects installed in those places.
Moreover, several factors affect the degree of adaptation or resilience of the recipient communities to renewable projects. According to Scotti and Minervini [36], among those main factors include the asymmetric distribution of economic resources, lack of negotiation at the local level, as well as the lack of competences in energy issues by the authorities. However, not only the authorities lack knowledge, but also the members of the communities [37]. Furthermore, Camagni et al., [34] suggest a lack of equity in the provision of basic services and wealth as key aspects. Another factor found is distrust and jealousy among the members of the communities [38]. Further, Table 1 shows the positive factors for the adaptation of communities to renewable projects.
Table 1 Factors that favor the adaptation of communities to renewable projects.
| Key factors | Author (s) |
|---|---|
| Mediation between communities and businessmen by local authorities. | [36] |
| Relationship of proximity and trust between the different actors. |
|
| Negotiation of a new social contract with new roles, institutions, and practices; for the economy, the State, the global society, and science. | [40] |
| Confidence in technologies. | [33] |
| Promotion of public participation by the authorities. |
|
| Community members must have financial, accounting, administrative, business, and impact evaluation skills. In the community, there must be social collaboration, a history of community action, and a strong community group. | [37] |
| Empower communities with high levels of knowledge about technical energy systems and the environmental implications of their choices. Education and awareness. |
|
| Change in social infrastructure, change in life and work patterns, allocation of benefits, and burdens in a different way. | [44] |
| There must be robust technologies, maintenance, financing strategies, and the inclusion of energy supply in broader regional development strategies. | [45] |
| Adequate distribution mechanisms that ensure social stability and proper access to education and health services. |
|
| Socioeconomic interests must be in harmony with environment and the cultural aspects. | [34] |
Some of the most relevant aspects that favor adaptation to renewable technologies are mediation by local authorities, empowering communities with knowledge, and providing them with good health, education, and infrastructure services, added to environment of respect and understanding of their culture. In this work, it is considered that an adequate supply of basic needs and services, and the equitable distribution of wealth in the communities, are key for the viability and sustainability of power generation projects through renewable energy sources. The findings in Table 1, among other aspects suggested by the literature reviewed, will be used as reference for developing a base set of indicators for the design of a mathematical model, fully detailed in the Methodology section. However, there are still pending challenges regarding indicators at a more disaggregated level, such as those related to community culture, social justice and inclusion, social participation, and community bonds.
Regarding the role that the geographical component plays in the social acceptance of renewable energy, Fast [43] found that there are certain concepts to consider such as: location (space with accumulated human meaning), distance decay (distance to which the turbine is located), and landscape (visual impact), a concept identified as the most critical factor for social acceptance [46]-[48]. In this regard, relevant social geography literature reveals landscape impacts associated with energy geography [46], [49]-[51]. In the case of Mexico, Perez-Denicia et al. [5] found that in this country the main opposition problems towards renewable technologies within the "landscape" component are: a) visual effects caused by high concentration of wind energy projects, and noise affecting cattle, and b) wind projects alter the sense of permanence of the landscape. The foregoing raises awareness about the importance that the geographic component plays in the process of acceptance of communities to renewable energy projects, especially wind energy.
Social acceptance of renewable energy projects is another key aspect for the success of new developments. Table 2 shows a review of the most important findings published in the special issue of Energy Policy (volume 35, issue 5, year 2007) on 'Social Acceptance of Renewable Energy Innovation'.
Table 2 Key factors for social acceptance of renewable energy projects.
| Key findings | Author (s) |
|---|---|
| This article analyzes community perceptions of a community consultation process related to wind energy in Australia by using procedural justice principles to evaluate fairness. According to the author's findings, perceptions of fairness influence how people perceive the legitimacy of the outcome, and that a fairer process will increase acceptance thereof. Furthermore, different sections of a community are likely to be influenced by different aspects of justice, namely by outcome fairness, outcome favorability, and process fairness. | [52] |
| In this paper, the authors analyze the most important factors for local acceptance of wind energy in France and Germany. The authors found that: a) site location is crucial to the success of a wind-park project, and b) local integration of the developer in terms of proximity, knowledge of the context, contacts with authorities and the media, and the ability to create a network of local actors around the project, are keyfactors of success. | [53] |
| This article compared multiple case studies carried out in the Netherlands, England, and a state in Germany to understand diverging achievements in wind power implementation. According to the authors, policymakers and wind project developers do not sufficiently recognize the nature of tension at local level. The authors argue that facilitating local ownership and institutionalizing participation in project planning can lead to better recognition and involvement of environmental, economic, and landscape aspects, relevant at the local level of implementation | [54] |
| In this paper, the author analyzes the relevance of wind turbine's location, and the phenomenon called NIMBY (people agree with the installation of wind turbines but not in their backyard). According to the author, "proximity has a strong influence on public attitudes to proposed projects, but the nature, strength and spatial scale of this effect may vary according to local context and 'value' of the land". On the other hand, "residents of stigmatized places are more likely to welcome facilities that are relatively 'green', while people who derive a more positive sense of identity from particular rural landscapes are likely to oppose such potential developments, especially if they also live there". | [55] |
| This article analyzes the socioeconomic dynamics associated with wind energy investment made by a community in Japan. The authors argue that mental and moral values such as consciousness, participation, compassion, and cooperation can activate progress toward a sustainable society. The authors also found that the advantages and disadvantages of renewable energies can be dynamically constructed by social systems and affect the social acceptance of renewable energy projects. | [56] |
| In this paper, the authors analyze some strategies that promote the social acceptance of microgeneration technologies such as solar PV, micro-wind, and micro combined heat and power production. The authors found that acceptance may be expressed in various forms: attitudes, behavior, and nvestments. They also argue that different deployment models with varying degrees of company and consumer involvement will have a significant nfluence on the social acceptance of domestic micro-generation and, therefore, the market uptake of these technologies. | [57] |
| This paper discusses the public acceptance of Carbon Capture and Storage (CCS). According to the authors' findings, CCS was judged slightly positive on average, while storage was judged more negatively. The risks and drawbacks of CCS and negative feelings were rated somewhat higher, however, than the benefits and positive feelings. Environmental NGOs were trusted more than government and industry. | [58] |
| This article performs an analysis of traditional biomass fuels in open fires, and it documented the adoption of improved biomass cookstoves. The authors found that a) socioeconomic level was positively correlated with the adoption of the improved cookstoves, but neither the age nor the educational levels were, b) the adoption process of technological innovation is slow and often requires many successive attempts to be able to permeate people's thinking, c) the payment of the stove did not seem to be an adoption factor, and d) it is important that every implementation program contemplates returning to a community later on, in order to give the opportunity to the "late majority" to adopt the innovation. | [59] |
| The author performs an analysis about the social acceptance of solar water heaters in Mexico City. By applying Rogers' technology adoption model, the author found that the most relevant factors for renewable energy adoption are a) awareness of the technology, b) costs of the technology, c) little environmental awareness, d) ability to understand the technology, and d) whether or not a potential user has the ability to "try out" an innovation. | [60] |
Among the findings, it is revealing how the perception of fairness in the processes associated with renewable technologies legitimizes the outcome suggesting that a fairer process will increase acceptance of the people towards renewable technologies [52]. Other aspects related to fairness in renewable energy processes have to do with the promotion and ease of local ownership and institutionalizing participation in project planning [54], as well as the level of integration achieved by the developers with the local authorities, the media, and their ability to create a network of local actors around the project [53]. Other fundamental aspects have to do with the location of the technology site [53] and its proximity to human settlements [55]. It was also found that little environmental awareness and ignorance of technologies affect the degree of acceptance of the population towards them [60] in addition to the risks, drawbacks, and negative feelings towards technologies, are also determining aspects for their acceptance. Finally, post-project follow-up was also recommended to allow the majority to be convinced of the innovations and end up accepting them [58].
SOLAR, WIND, AND BIOMASS
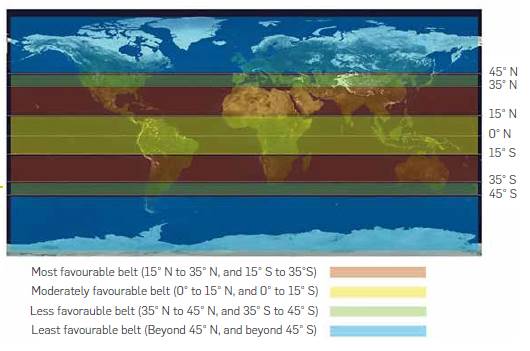
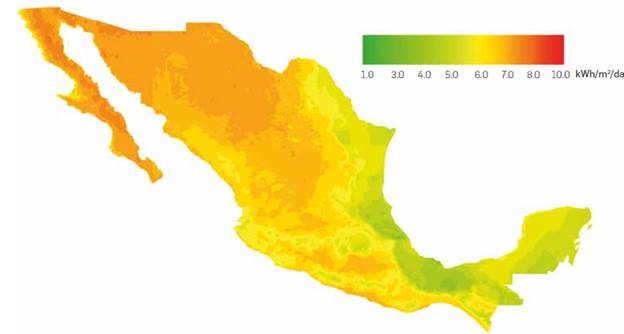
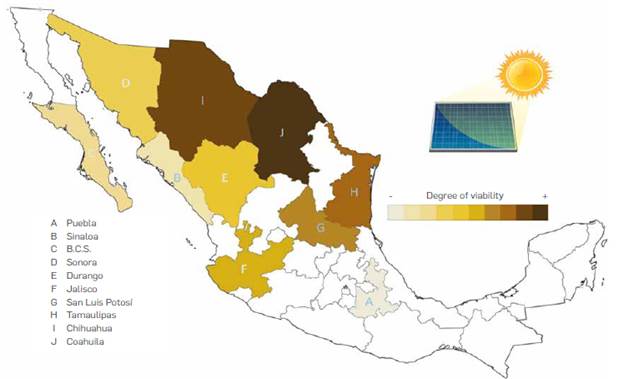
Mexico is located within the so-called "solar belt" with the best solar irradiation conditions (between latitudes 15° N to 35° N), as shown in Figure 1. The country has an average of 5.5 kWh/ m2 [61]; however, some areas can reach around 8.5 kWh/m2 [62], especially the northern states and the central area, as indicated in Figure 2. To date, Baja California Sur is the leader state in power generation through solar energy, with an installed capacity of 39.8 MW, generating 32.5 GWh/year [6],[7].
In this project, 10 states were selected for each technology (solar, wind, biomass). These states were selected following the results published by the National Atlas of Areas with High Potential for Clean Energy, and the National Inventory of Clean Energies [6], [7], based on studies conducted by the Federal Electricity Commission (CFE), the Energy Regulatory Commission (CRE), and the Meteorological Center of Mexico, on the best potential by state for electricity generation through renewable sources in Mexico. The selected states in the solar and wind category are shown in Table 3.
Table 3 Mexican states selected in this work for solar and wind.
| Solar | Wind |
|---|---|
| Chihuahua | Coahuila |
| Sonora | Tamaulipas |
| Coahuila | Yucatan |
| Jalisco | SLP |
| Durango | Jalisco |
| San Luis Potosi | B.C. |
| B.C.S. | Oaxaca |
| Tamaulipas | Puebla |
| Sinaloa | Durango |
| Puebla | Sonora |
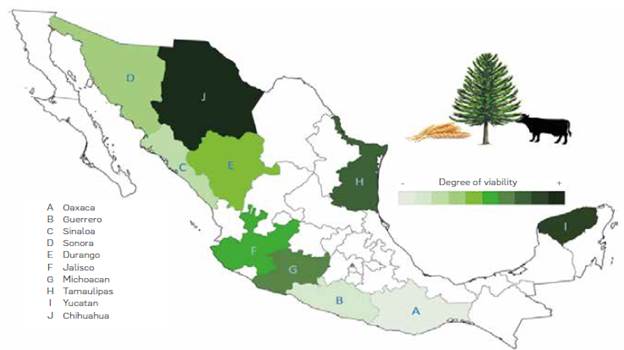
Regarding wind energy, Mexico has good resources in almost all the country, as shown in Figure 3. The best resources are distributed in the peninsula of Baja California, the central region, the Gulf Coast, the Yucatan Peninsula, and the Tehuantepec isthmus [9], Currently, the state of Oaxaca is by far the leading state in the generation of electricity through wind energy, since it has an installed capacity of 2,096.35 MW and generates 7,072.479 GWh/year, which represents 92% of the national production through this renewable source [5] Biomass is also an abundant resource in Mexico as this raw material can be obtained from various sources such as urban waste, agricultural and forestry, livestock, or sustainable logging, as indicated in Figure 4. Veracruz is the state that currently produces more electricity from biomass since it generates 38% of the total production from this source. The states considered in this study are those with the highest biomass resources, in terms of terajoules in a whole year (TJ/year), from the 4 categories shown in Figure 4. The 10 leading states considered are shown in Table 4.
Table 4 Top ten states with the best biomass resources in Mexico.
| Biomass | ||
|---|---|---|
| Solar | TJ/year | TWh/year |
| Sonora | 199,204 | 55.33 |
| Chihuahua | 195,845 | 54.4 |
| Jalisco | 182,204 | 50.61 |
| Sinaloa | 178,854 | 49.68 |
| Yucatan | 175,104 | 48.64 |
| Oaxaca | 174,503 | 48.47 |
| Guerrero | 174,503 | 48.47 |
| Tamaulipas | 159,504 | 44.3 |
| Michoacan | 140,253 | 38.95 |
| Durango | 126,704 | 35.19 |
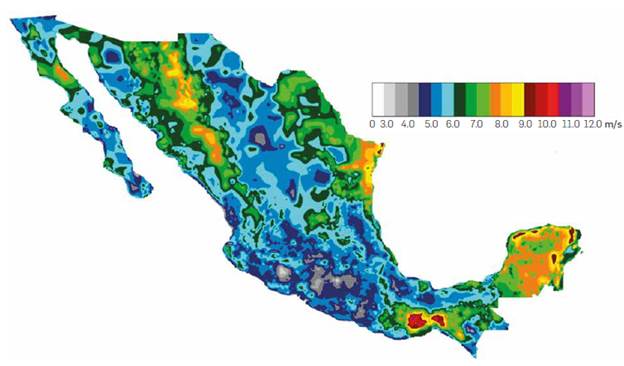
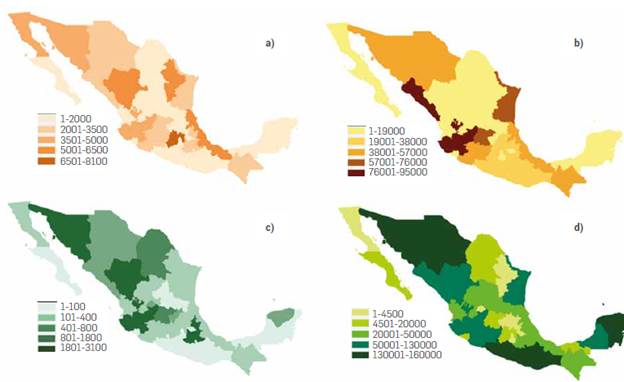
Figure 4 Biomass resources (TJ/year) from different sources in Mexico, a) Urban waste, b) Agricultural and forestry waste, c) Livestock residues, d) Sustainable logging. Source: Adapted from [6], [7].
In this section, an analysis of renewable energy resources in Mexico was conducted, finally, 10 states in each category (solar, wind, and biomass) were selected according to the quality of resources and their potential for electricity generation, from highest to lowest. In some cases, a single state appeared in more than one category, as shown In Table 5. That means that some areas have excellent resources from more than one renewable source, which made it possible to compare the viability for power generation from two sources; in some cases (Durango, Jalisco, etc.), it was possible to compare the three sources.
Table 5 Mexican states with excellent renewable resources in more than one category.
| Solar | Wind | Biomass | |
|---|---|---|---|
| Chihuahua | √ | null* | √ |
| Coahuila | √ | √ | null |
| Durango | √ | √ | √ |
| Jalisco | √ | √ | √ |
| Puebla | √ | √ | null |
| S.L.P. | √ | √ | null |
| Sinaloa | √ | null | √ |
| Sonora | √ | √ | √ |
| Tamaulipas | √ | √ | √ |
| Yucatán | null | √ | √ |
| Oaxaca | null | √ | √ |
* When some state lacks any technology, the "null" label is placed.
INDICATORS
An indicator is a parameter or value that provides information about a phenomenon but also has a meaning beyond the properties directly associated with the value of the parameter [63]. According to Huang et al., [64], the basic components of an indicator are data On the other hand, an indicator is the operational representation of an attribute of a system, whereas an index is a more complex aggregate variable made up of several indicators. These can be used as tools that help simplify complexity and provide guidance on sustainable development [65].
Indicators can help make better decisions and carry out more effective actions by simplifying, clarifying, and making information available to decision-makers and policy-makers. Indicators can ncorporate knowledge of the physical and social sciences into decision making, thereby helping to measure and recognize progress toward sustainable development goals [66], Singh et al. [67] summarize the use of indicators to: "a) anticipate and assess conditions and trends, b) provide early warning information to prevent economic, social and environmental damage, c) formulate strategies and communicate ideas, and d) support decision-making."
For developing this research, the 3 pillars of sustainability (social, environmental, and economic) are used as a guide. Therefore, the ndicators to be considered should be included in one of these categories.
INTEGRATION OF THE SET OF INDICATORS
Some of the key aspects of integrating a group of indicators are that data must be available from the public, scientific, or institutional sources for them to be reliable [68]. This may be a constraint since the existence of data varies from one country to other. In addition, data is becoming scarcer, at large, when seeking information at the state or municipal level, as it Is the case of Mexico. Thus, our main source of information is the National Institute of Statistics and Geography (INEGI), which Is the Mexican government agency in charge of gathering Information In various areas such as health education, economy, environment, and housing. In the case of this research, we require Information on Indicators at state level. This mplies that data is even scarcerthan at national level. Consequently, the data will be considered over a 10-year period (due to the availability of data, it will be from 2000 to 2010). To integrate the set of indicators, what is recommended by scientific literature [34] was considered (clean potable water, sanitary facilities, solid waste collection, housing, basic social services, education, employment, environment, infrastructure), and the findings from Tables 1 and 2. Then, the performance of each state was assessed, based on the premise that the more equity In the distribution of wealth and the provision of basic services, education and infrastructure, the greater the degree of adaptation or resilience from communities towards renewable technologies [34]-[36], [42], [44], Based on the above and on the availability of reliable data in Mexico, the set of indicators shown in Table 6 was obtained.
The indicators set in Table 6 were obtained for each of the states from Tables 3 and 4. In addition, other features such as the capacity factor, see Table 7, the life cycle of each technology and emissions, as shown in Table 8, were taken Into account.
Table 7 Indicators considered in this study located in one of the three categories of sustainable development.
| Wind | Solar | Biomass | Source | |
|---|---|---|---|---|
| Capacity factor | 38% | 16% | 76.50% | [69] |
Table 8 Indicators associated with the life cycle and emissions of each technology
| Wind | Solar | Biomass | Source | |
|---|---|---|---|---|
| Cost per kW installed | 2346 USD | 2025 USD | 5792 USD | [70] |
| Cost per kW generated | 0.07 USD | 0.27 USD | 0.08 USD | [69] |
| C02 emissions per kWh generated | 17 g | 102 g | 380 g | [71] |
| Useful life | 20 years | 32 years | 25 years | [70] |
| Water consumption (USD/kWh) | 0 | 0 | 0.04 USD | [70] |
Let be A⊂R ⇒δ is called the maximun value of A if δ∈A ⋀ a≤δ, ∀a∈A Let be A⊂R ⇒λ is called the minimun value of A if λ∈A ⋀a ≥ λ, ∀a∈A R=real numbers
DESIGN OF THE MODEL
Then, because the data obtained were in different units, it was necessary to go through a normalization and aggregation process. The normalization process was based on finding the maximum and minimum value for each Indicator among the whole set of selected states:
The goal was to obtain values between zero and one, where the values closer to zero mean very sustainable, and values closer to one are the least sustainable. Subsequently, to have all the values of the indicators in the same range (0-1), they were standardized by adding 15% of its value to δ. Likewise, 15% were subtracted from its value to λ (values that we have called upper and lower quotas respectively), Equations 1) and 2). Finally, we used Equation 3) to get the standardized value.
Table 6 Indicators considered in this study located in one of the three categories of sustainable development.
| Solar | Environment | Economic |
|---|---|---|
| Life expectancy at birth | Complaints received on environmental issues | Airports |
| Percentage of migrant population | Number of urban solid waste transfer stations | Public transportation |
| Percentage of population living in extreme poverty | Public investment in urbanization and environment | Public investment in economic development |
| Percentage of households with piped water | Reforested area | Public investment in electrification |
| Percentage of households with electricity | Trees planted | GDP |
| Power users | Untreated municipal wastewater discharge points | |
| Percentage of total illiterate | Urban areas | |
| Total schools in basic and upper secondary education | ||
| Unemployment rate of the total population | ||
| Population entitled to health services | ||
| Crimes occurring | ||
| Medical staff |
Where:
δ → Maximum value.
λ → Minimum value.
xi → Value of the i-th indicator, i = total number of states.
α → Upper quota.
β → Lower quota.
I → Standardized value.
Then, an aggregation process or arithmetic mean was applied to obtain a single value for each state. In this case, Equation 4) was used.
Where:
N → Number of indicators -24-.
i → Counter.
qi → Value of the i-th indicator.
After going through the mentioned processes, the Intent is to determine from the three types of technologies, which is the most viable to produce electricity in the states that have renewable resources in more than one category? As shown in Table 5, the objective function, and the system equations are established Equations 5) and 6) respectively.
Objective function

System equations:
Where:
i → State.
j → Technology.
c → Coefficient corresponding to the ij-th variable.
x → System variable.
In addition, the intent Is to determine, from the 10 states selected by each renewable source, in what state is it most feasible to generate electricity for each type of technology? To achieve the aforegoing the following model was designed, Equations 7) and 8):
Objective function
System equations:
MD=Maximun power demand (14,000 GWh/year), j=1,2,3
Where:
i → State,
j → Technology.
y → System variable.
Finally, the equations of the resulting models were solved using the Linear optimization software "Lingo -https://www.llndo.com/index.php/products/lingo-and-optimlzation-modeling-",
5. RESULTS AND DISCUSSION
It was possible to establish the most suitable state for power generation by each type of renewable source. The results show that the state of Coahuila is the best option for power generation through wind and solar energy. In the case of biomass, the best state is Chihuahua, as shown In Table 9.
Table 9 Leading states for sustainable power generation in each category.
| Wind | Best wind | Solar | Best solar | Biomass | Best biomass |
|---|---|---|---|---|---|
| Coahuila | √ | Chihuahua | Sonora | ||
| Tamaulipas | Sonora | Chihuahua | √ | ||
| Yucatán | Coahuila | √ | Jalisco | ||
| SLP | Jalisco | Sinaloa | |||
| Jalisco | Durango | Yucatán | |||
| B.C. | San Luis Potosi | Oaxaca | |||
| Oaxaca | B.C.S. | Guerrero | |||
| Puebla | Tamaulipas | Tamaulipas | |||
| Durango | Sinaloa | Michoacán | |||
| Sonora | Puebla | Durango |
Additionally, the following maps show the degree of viability for power generation through wind, solar, and biomass in Mexico Figures 5, 6, and 7 respectively.
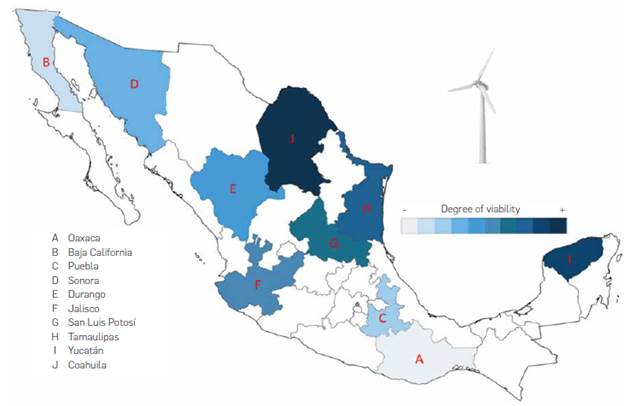
According to the main findings, from the group of 10 states with the best wind resources in Mexico, the state of Oaxaca is the least viable for electricity generation. In contrast, Oaxaca is, in fact, the state with the best wind resources in the country [5]; currently Oaxaca produces 92% of the country's total wind power.
Why are the results of the model and the reality of Oaxaca so contrasting? According to the comprehensive analysis on the best conditions for community adaptation, resilience, and acceptance of renewable projects made in this work, Section 2, and the great development of wind plants in Oaxaca, a large number of reported success stories, as well as significant socio-cultural and economic progress in the state would be expected. However, as a result of developing wind facilities in Oaxaca, a wide range of socio-cultural and economic problems have been reported in scientific literature. Some of the most pressing difficulties include social conflicts due to Incorrect information, consultation and participation schemes, rregularitles in the land leasing process, and very low lease payments, loss of traditional economic activities as a result of wind projects, increased marginalization of the population, economic nequality, tension and division within communities [5], [15], [16] [72]. Furthermore, in the state of Oaxaca, more than three-quarters of the population considers that quite often the government maintains corrupt practices [73].
According to the Human Development Report of the United Nations Development Program (UNDP) in its 2019 version [74], Oaxaca had the second-worst performance, out of a total of the 32 states of Mexico, in the following indices: Human Development Index (HDI) -0.678-, Municipal Education Index (MEI) -0.566-, Municipal Income Index (MII) -0.683- and the worst performance, of 32 states, in the Municipal Health Index (MHI) -0.812-[74].
The case of Oaxaca shows that having the best renewable resources is not a sufficient condition for projects to be sustainable and capable of benefiting all stakeholders. In fact, the literature reports irregularities from the very first steps of the process, without adequate consultation and participation schemes. Evidence suggests that energy companies have only considered the technical and economic aspects, affecting the weak socio-cultural balance of the communities; in addition, local authorities have not carried out mediation processes between the communities and the businessmen. As long as there are no institutional changes that improve socio-economic conditions and promote the well-being of the communities in Oaxaca, cases such as those described above will persist.
Regarding solar energy, although the best solar resources are distributed among the states of the center and north of Mexico, Figure 6 shows a tendency where the most viable sites to generate electricity by solar energy are those that border the southern part of the United States. These states have a better performance in socio-economic indicators than most of the rest of the country. In this context, the states of Sonora, Chihuahua, Coahuila, and Tamaulipas stand out among the most viable states for power generation.
The states of Coahuila and Chihuahua (most viable states for power generation through solar) are among the states with the highest competitiveness standards in Mexico [75], [76], this is partly due to a good performance on indicators such as public and legal security, sustainable management of the environment, public inclusiveness, as well as economic stability and innovation.
According to the UNDP [74], the states of Coahuila and Chihuahua rank seventh (0.791) and eleventh (0.782) respectively in the Human Development Index. Regarding the Municipal Education Index, Coahuila ranked seventh (0.678), while Chihuahua was ranked in the twelfth place (0.663). UNDP developed a Municipal Functional Capacities Index (IMFC), which measures the degree of development of municipal functional capacities and their interrelation with human development and the ability to meet the SDGs. The municipal capacities evaluated are a) involving relevant actors, b) diagnosing a situation and defining a vision, c) formulating policies and strategies, d) budgeting, managing, and implementing projects, and e) evaluating programs and projects. In this regard, the state of Coahuila ranked second nationally (0.490), while Chihuahua ranked in the seventeenth place (0.347) [74]. This indicator represents a good approximation of the capacity for innovation and institutional change, as observed in section 2, required to carry out the necessary adjustments to achieve adaptation, resilience, and acceptance of the communities in the face of renewable projects.
Compared to the vast scientific literature on wind projects in Mexico, there are still no works that report, at least the socio-cultural implications of solar projects in the country. However, based on the performance of the aforementioned indicators, it is expected that the reported benefits will be better than in the case of Oaxaca (wind) and that the states reported as the most viable for solar generation will have greater capacity of adaptation, resilience, and acceptance to this type of projects. Although there is still a lot of work to be done to improve the performance in the indices, Chihuahua and, especially Coahuila, have performed above the national average, and much higher than most of the states considered in this work.
It is interesting to note that in the case of biomass, the border states of Chihuahua, Sonora, and Tamaulipas once again stand out among the most viable states for electricity generation, as shown in Figure 7. Additionally, the state of Yucatan has stood out in biomass and wind, being the only state in the south of the country viable for power generation, in terms of sustainability.
In the case of the states that were present In more than one category, it was possible to establish the type of energy that Is most viable. The states and their categories are shown In Table 10.
Table 10 Most suitable technologies, according to the degree of sustainability, for power generation by state.
| Solar | Wind | Biomass | |
|---|---|---|---|
| Chihuahua | √ | null | |
| Coahuila | √ | null | |
| Durango | √ | ||
| Jalisco | √ | ||
| Puebla | √ | null | |
| S.L.P. | √ | null | |
| Sinaloa | √ | null | |
| Sonora | √ | ||
| Tamaulipas | √ | ||
| Yucatán | null | √ | |
| Oaxaca | null | √ |
When some states lacked any technology, the "null" label was placed. Among the most relevant findings highlight; wind is the most viable source for electricity generation, as this technology appeared in nine of the eleven states with good energy resources in more than one category. Solar energy stands out In two states, while biomass did not appear In any state. This does not mean biomass is not viable for electricity generation, especially when compared to fossil fuels, instead, it means that wind and solar energy are more viable than biomass. In the case that some state has abundant biomass and non-solar or wind resources, biomass will represent a better option than fossil fuels. In order to have a real economic benefit, technologies related to renewable energy must be designed and produced in the country. Otherwise, the creation of jobs will be temporary [15].
In the case of Table 9, it shows that of the ten states with the best solar resources, Coahuila is the most viable state for power generation through solar energy and, furthermore, it is also the most viable state for power generation through wind. With respect to the 10 states with the best biomass resources, Chihuahua is the most suitable for electricity generation. It is worth noting that not all states fall into all three categories. This depends on the number of available resources (wind, solar, and biomass) in the states. In some cases, such as Coahuila, Chihuahua, Oaxaca, and Puebla, they are among the top 10 states in 2 different categories, while in other cases such as Tamaulipas, Jalisco, Durango, and Sonora, they all have excellent renewable resources in the three categories. When a state has renewable resources in more than one category, it Is possible to compare and determine which renewable technology is the most suitable. That Is the purpose of Table 10, which Indicates the most viable technology by state (only in those states with more than one category). For example, in the case of Chihuahua, of the 10 states under the biomass category, this state is the most viable for electricity generation, as indicated by Table 9. Moreover, since this state is also within the solar category when both categories are compared, solar technology is the most suitable, as Indicated by Table 10. Finally, the model assesses the viability for power generation and Figures 5, 6, and 7 offer the degree of suitability according to all the criteria assessed in this work.
CONCLUSIONS
In the world, the participation of Renewable Energy Sources (RES) in power generation increases every year. Currently, RES contributes 27.3% of electricity generation globally [1]. In Mexico, 20.3% is generated by RES [77] and there has been a rapid growth of renewable technologies, especially wind energy, generated in the country since 2002 with an annual growth rate of 114% [78] and a production of 16,726 GWh in 2019 [79], Solar energy has been produced since 2012 and although it has an annual growth rate of 102%, only 8,399 GWh were produced in the country in 2019, Finally, 1,675 GWh were produced by biomass [79], Wind energy has been produced in Mexico for almost 20 years and there is extensive research on its socio-cultural and economic impact.
According to our main findings, the most suitable states for power generation in Mexico are Coahuila and Chihuahua, which account for the highest competitiveness standards in Mexico [75], [76], and are also among the best evaluated in development indexes of the UNDP. Regarding the renewable sources assessed, wind energy is the most viable compared to solar energy and biomass, which rank second and third respectively.
On the other hand, the case of Oaxaca is emblematic. Oaxaca is the Least suitable state for electricity generation, while it is currently where most aeolic power is produced in the country. However, current projects in Oaxaca are associated with socio-cultural and economic conflicts such as the lack of social inclusion and community participation, irregularities in land leasing processes, Loss of traditional economic activities as a result of wind projects, ncreased marginalization of the population, economic inequality and migration, and tensions and division within communities [15] [16], [72], Furthermore, Oaxaca is the second state with the worst performance in well-being indicators of the UNDP.
Additionally, among the main constraints for renewable projects to be sustainable (socially, economically, and environmentally) and successful are social acceptance, the satisfaction of the basic conditions of social well-being and community resilience, and the role that institutions play to support the change in the "rules of the game" and innovation. In that sense, this project raised the assumption that 'communities with the best performance in social, economic, and environmental aspects can better adapt and be more resilient to energy projects and have more favorable conditions to be beneficiaries of renewable technologies'. According to the comprehensive analysis of the literature carried out and the main findings of this research, we consider the aforementioned assumption to be true and, furthermore, we conclude that in the case of those states that have excellent renewable resources but poor performance in social, environmental and economic indicators, the government, decision-makers, and private companies should work hard together with the communities to be able to provide them with quality services and opportunities to increase their level of well-being, promote participation, innovation and, very importantly, involve people in decision-making processes since the very first stages, so that the inhabitants acquire necessary skills to become involved in energy projects, reach a greater degree of resilience, and benefit socially and economically from this type of facilities.
This work provides a vision beyond the technical and economic aspects of renewable generation and proposes a more friendly integration of these technologies within the environment and society. This methodology can be implemented in most developing countries, such as those in Latin America, as they have similar socio-cultural and economic conditions. However, it can also be adopted by other more developed regions as they also face community issues associated with renewable technologies, especially considering that power generation through renewables is distributed by nature. Finally, the availability of information on social, environmental, and economic indicators disaggregated enough according to the required assessment (village, town, municipality, state, country, etc.) represents a challenge that should be addressed by government authorities as soon as possible.
We hope this project will serve as a framework for governments, companies, and all stakeholders involved in the planning and design of future electric projects at a more all-inclusive level, where socioeconomic aspects of communities are considered as determining factors towards sustainable energy production.

