


 texto em
  Inglês (pdf)
 Artigo em XML
 Referências do artigo
 Enviar este artigo por email
 Citado por SciELO
  Citado por Google
  Similares em
SciELO
Similares em
SciELO  Similares em Google
 Permalink
Introduction
The growth of international trade and the interdependence between the economies of different nations have grown expensively since the 1990s (Trejos, 2009). This is partly due to the economic integration of various countries. At the global level, the trade liberalization that has been practiced corresponds to the basic integration modality, i.e., the gradual and progressive elimination of tariff and non-tariff rates between trading partners (Avendaño & Acosta, 2009). This integration, according to economic theory, indicates efficiency and well-being; however, it can bring about a displacement of internal production, demanding greater competitiveness from national producers (Tapia, 2006). Germán-Soto and Escobedo (2011) consider that the opening of an economy to allow free competition will make it easier for that country to increase production and well-being levels in the population, causing the prices of goods and services to descend to ever lower competitive levels.
Having bet on trade openness by signing thirteen free trade agreements with fifty countries and nine economic complementation as well as partial scope agreements (Secretaría de Economía [SE], 2020) aiming to liberalize and reduce trade barriers and reach a trade openness index of 70% (Ayala et al., 2011), Mexico continues to be one of the least competitive countries worldwide, ranking 51 in 2016 according to the World Economic Forum (2019). Loosing out on the trade opening process has mainly affected the agricultural and livestock sectors of the country, as it faces a higher number of competitors who offer agricultural goods of better quality and lower prices (Del Moral & Murillo, 2015), in detriment of national- origin goods, and as a consequence of the lack of policies aimed at strengthening the competitiveness of agricultural activity.
An example of the lack of policies in Mexico that facilitate the appropriation of the advantages offered by trade liberalization is the North American Free Trade Agreement (NAFTA) signed by Mexico, the United States, and Canada, which entered into effect on January 1, 1994. With NAFTA in force, trading products such as ornamental plants, live cattle, carcass in its different presentations, honey and nuts, was liberalized (Schwentesius & Gómez, 2001). Starting from the recognition of asymmetries in the economic structure of these three countries, a tariff reduction process was established so that those products that presented inequality could reach competitiveness. In addition to this, both the United States and Canada implemented a protection policy, meanwhile, Mexico, on the contrary, withdrew support and subsidies for agricultural activity in detriment to the sector and making foreign goods more competitive against national production (Vidaurrázaga & Cortez, 2000).
After 26 years in force and an arduous renegotiation process, NAFTA was replaced by the United States- Mexico-Canada Treaty (USMCA or T-MEC, for its acronym in Spanish) (Martínez & Herrera, 2020), that entered into force on July 1, 2020, after the United States declared its intention to impose tariffs on all Mexican products as a measure of pressure due to immigration problems.
Similarly, the Mexico-Japan agreement, which entered into force on April 5, 2005 (SE, 2020), makes available preferential access and import quotas to sensitive products for Japan, but of great interest to the Mexican agricultural sector, such as orange, orange juice, pork, beef and chicken (García de León, 2010; Tokoro, 2006). Likewise, the Mexico-European Union agreement entered into force on July 1, 2000, where the compensatory quota for frozen beef from the European Union is eliminated, regardless of the country of origin.
The economic opening of countries has its origins in the concept of absolute advantage introduced by A. Smith, who, with his analysis, demonstrated the benefits of free trade by showing that it promoted global efficiency in production, since it allows each country to exploit their absolute advantage when elaborating their products, with an improvement in their commercial conditions, without harming others (Pugel, 2004). Krugman and Obstfeld (2006) considered that a trade pattern cannot be determined solely from the absolute advantage, a concept in their opinion limited, but it is, on the contrary, David Ricardo's comparative advantage that determines who will produce a good.
In this regard, Krugman and Obstfeld (2006) mentioned that, when a country can produce a unit of a good with less work than another country, it can be said that the first country has an absolute advantage in the production of a good. However, the trading pattern cannot be determined solely from absolute advantage. When there is no trade, the relative prices of the good are determined according to the units of work; meanwhile, when there is, prices will not be determined solely by national considerations, but are also determined by supply and demand. Thus, countries will export the goods that their labor produces relatively more efficiently and import the goods that their labor produces relatively more inefficiently.
On the other hand, Pugel (2004) reported that a country will have a comparative advantage when it exports those goods and services that it can produce at a lower opportunity cost and will import those goods and services that, otherwise, it would produce at a higher opportunity cost.
The comparative or relative advantage term evolved into the concept of competitive advantage that, unlike the first, can be created from product differentiation and cost reduction, under the ability to innovate (Ruttan, 2002, cited by Garay et al., 2012).
Contrary to the benefits that in theory should be generated for the Mexican livestock subsector, trade liberalization brought an increase in the trade imbalance, mainly derived from the technological lag and lack of innovation, which limited its ability to grow, and accentuated its overboard dependence, facing competition that offers better quality and price (Carrera & Bustamante, 2013; Del Moral & Murillo, 2015). Macías (2010) affirmed that Mexico is not a competitive agro-exporter, but is based on the comparative advantages of David Ricardo (geographic location and cheap labor). Conversely, the United States, base their success on creating competitive advantages through lower production costs, product differentiation, and more competitive prices (Carrera & Bustamante, 2013), with which consumers have access to cheaper products (Gómez-Tenorio et al., 2020).
For Mexico, the livestock subsector is of fundamental importance as it contributes with 29 % of the agricultural Gross Domestic Product (GDP) (Centro de Estudios para el Desarrollo Rural Sustentable y la Soberanía Alimentaria [CEDRSSA], 2019). Besides, bovine meat participated with the generation, on average, of 39 % of the value and 32 % of the national livestock production volume during the period from 1990 to 2016, when 1,529,851 annual tons of beef were produced, with an average annual growth rate (AAGR) of 2 %, and generating 43,528 million pesos (MXN) annually, with an annual growth rate of 11 %. Veracruz (14 %), Jalisco (12 %), Chiapas (6 %), and Sonora (5 %) were the leading producing states (Servicio de Información Agroalimentaria y Pesquera [Siacon], 2020).
The national supply of beef is complemented by imports that, during the period under study, averaged 245,889 tons per year, and 51,675 tons were exported on an annual average (Food and Agriculture Organization of the United Nations [FAOSTAT], 2019), which generates an imbalance in the trade balance, added to other natural factors, such as droughts, which affected meat production, reducing both the cattle herd and forage production. This directly impacts the increase in production costs and an increase in the price of beef to the final consumer (López et al., 2009). Another critical factor in the market for this product is the decrease in demand, attributed to changes in eating patterns, by associating the consumption of this product with disease risks, favoring its substitution with poultry or pork (Schnettler et al., 2008), which has led to a 17 % decrease in per capita consumption of beef during the period 2000-2016 (FAOSTAT, 2019).
For this reason, the aim of this study is to measure the competitiveness of Mexican beef exports and the trade disequilibrium of its balance at the international level, from 1990 to 2016, through the generation of foreign trade indicators as worldwide market share, share of beef imports in the Mexican market, import penetration rate, revealed comparative advantage coefficient, revealed comparative advantage coefficient of suppliers (importers), and production exposed to competition. The hypothesis underlying this approach is that the lack of policies to promote the competitiveness of agricultural activities is an obstacle to taking advantage of the benefits of trade integration and counteract, in the long term, the impact of the deficit on the trade balance of agricultural products.
Materials and methods
Trade balance records the flow of goods made by a country with the rest of the world (Dornbush et al., 2002), namely, it reflects the difference between exports and imports made by a country. The positive balance due to the entry of foreign currency via exports generates an increase in production that can be reflected in the generation of employment and a higher income, allowing the stimulation of the national economy. However, the deficit balance, despite implying a displacement of national production, can be beneficial for consumers if imported products are less expensive (Rodríguez, 2009). Information on the total imports and exports of the agricultural sector, the livestock subsector, and the bovine meat activity for the period 1990-2016 from the Commercial Information System Via Internet (Siavi, for its acronym in Spanish) (Siavi, 2018) was required to identify the participation and performance of the bovine meat production activity.
The annual growth rate of the export and import volume of beef was estimated to measure the effects of the commercial relationship. This methodology establishes four levels of impact according to trade flows: high, when the growth rate is greater than 15 %; medium, when the trade growth is within the range of 6-15 %; low, when a change between 2-5 % is registered; and insignificant, when the growth trade is less than 2 % (Zahniser & Link, 2002). This indicator was calculated from 2003 to 2016, since the Siavi only presents information from 2003 and onwards.
Six indicators that are explained below, were estimated to determine the competitiveness of Mexico at the international level concerning beef (Omaña et al., 2014; Recalde & Barraud, 2002; Soto, 2018):
1. Participation in the world market (PMij). Reflects the level of supply by a country and its global competitiveness level; that is, it measures the share of the exports of a product in the world export market (equation 1). This indicator is measured in percentage (from 0 to 100): the higher the value obtained, the greater the competitiveness.
 Equation 1
Where PMij = Share in the world market of product i from country j, (%); Xij= Amount or value of the exports of product i from country j; Xim = Amount or value of world exports of product i.
2. Share of beef imports in the Mexican market (PMije). It measures the share of imports of the product in the specific import market (equation 2).
 Equation 2
Where PMije = Participation in the Mexican import market of product i (%); Mije = Amount or value of Mexican imports of product i from overseas; Mie= Amount or value of Mexican imports of agricultural products. It ranges from 0 to 100; the higher the value, the more competitive.
3. Import penetration rate (IPR). Indicates the share of imports in domestic demand (equation 3). In other words, it measures the proportion of the domestic market that is supplied with imports (Soto, 2018). The higher the import penetration rate, the greater the dependence of domestic consumption on imports. It is defined as the quotient between imports of a product in a country and the apparent consumption (sum of national production plus imports minus exports) (Omaña et al., 2014; Recalde & Barraud, 2002).
 Equation 3
Where IPRij = Penetration rate of imports of product i in country j (%); Mij = Imports of product i in country j (t); Cij = Apparent consumption of product i in country j (t). The indicator goes from 0 to 100; the higher the value, the more competitive the imported product.
4. Coefficient of revealed comparative advantage (RCA). It allows analyzing the ability of a country to compete in exports with a particular product in a defined market (Vollrath, 1991). The index is used to analyze the comparative advantages or disadvantages of the trade of a country with its trading partners, and is based on the Ricardian comparative advantage concept (Soto, 2018) (equation 4).
 Equation 4
Where RCAij = Revealed comparative advantage of exports of product i from country j (%); Xij = Value of exports of product i from country j (US$); Xnj = Value of the total agricultural exports of country j (US$); Xim = Value of exports of product i in the world (US$); Xnm= Value of the total global agricultural exports (US $). The higher the value of the coefficient, the greater the degree of competitiveness; the minimum value is 0, and the maximum value is ∞ (Recalde & Barraud, 2002).
5. Coefficient of revealed comparative advantage of suppliers (importers) (RCAije). This indicator allows measuring the participation of suppliers in a specific market, where the higher the value, the greater the competitiveness (equation 5).
 Equation 5
Where RCAije = Revealed comparative advantage of imports of product i of country j in market e (Mexico); Mije = Value of Mexican imports of product i of country j (US$); Mnje = Value of total Mexican imports of country j (US$); Mie= Value of imports of product i in Mexico (US$); Mne= Value of total imports from Mexico (US $).
6. Production exposed to competition (PEC). Shows the percentage of the production of a good or sector exposed to external competition (equation 6). It assumes that exports face international competition in world markets and that production for domestic consumption is subject to competition from imports (Recalde & Barraud, 2002).
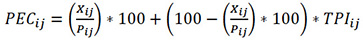 Equation 6
Where PECij = Production exposed to the competition of product i in country j; Xij = Exports of product i from country j (ton); Pij = Production of product i from country j (ton); TPIij = Penetration rate of imports of product i in country j (fraction). The values generated by this indicator range from 0 to 100, indicating greater competitiveness as it grows (Omaña et al., 2014; Soto, 2018).
Results and discussion
The agricultural trade balance of Mexico showed a deficit during the period between 1990 and 2016, except for 1995, the year of the economic crisis known as the tequila effect (Ffrench-Davis, 1999), which benefited exporters by making products more competitive overseas (Ayala et al., 2008, 2011; Carrera & Bustamante, 2013) (figure 1).
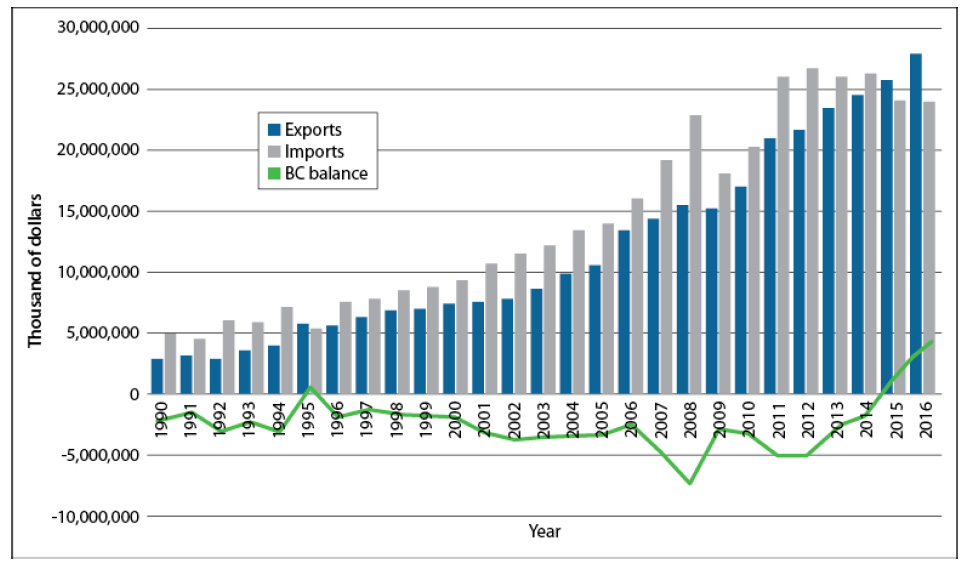
Source: Elaborated by the authors with data from FAOSTAT (2019)
Figure 1 Mexico: Trade balance of the agricultural sector, 1990-2016 (thousands of dollars)
The total exports of the Mexican agricultural sector presented an annual growth rate above 9 %, while imports grew at a rate of 7.8 %. Despite the growth differential, the trade balance is in deficit for Mexico. This deficit worsened after NAFTA, which stipulated the process of tariff reduction mainly for the industrial and agricultural sectors, the latter being the one with the most significant protection and delay in the tariff reduction process. However, shortly after the agreement entered into force, less than 2 % was paid for import duties on agricultural products to Mexico (Tapia, 2006).
Livestock activity has followed the same deficit trend as the agricultural sector throughout the period. Growth in beef imports deepened the deficit in the trade balance (figure 2).
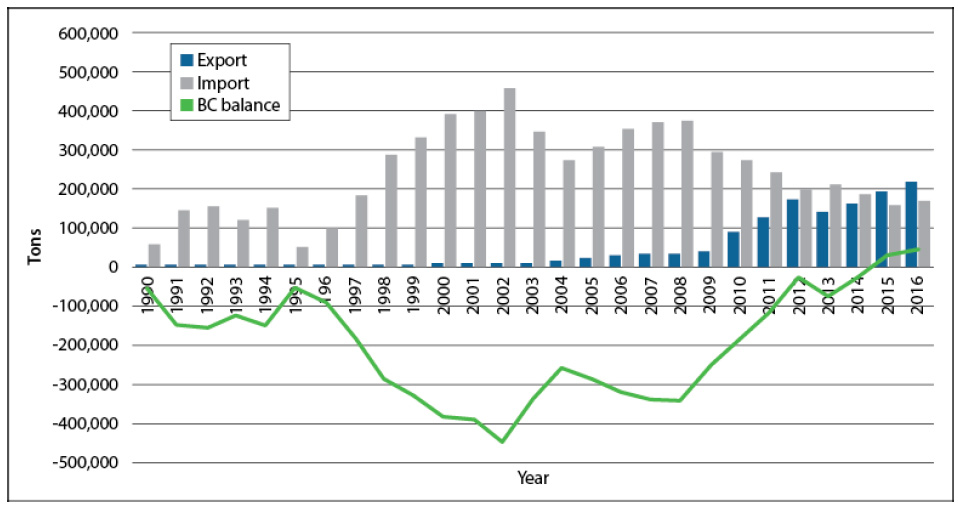
Source: Elaborated by the authors with data from FAOSTAT (2019)
Figure 2 Mexico: Bovine meat trade balance, 1990-2016 (tons)
During 2003 and 2004, due to the outbreak of bovine spongiform encephalopathy in the United States, imports decreased by 4 % (Benítez-Ramírez et al., 2010). However, Mexico was required to import beef to meet the national consumption needs (Ayala et al., 2011; Gómez-Oliver, 2008), increasing the trade deficit of the livestock sector.
During the 1990-2016 period, Mexico imported an average of 245,889 tons per year of beef, presenting an average annual growth rate of 3.91 % (table 1), which caused an increase in the trade deficit, mainly from 1996 (date after the entry of the first trade agreement in 1994 and the crisis period in Mexico during 1995), primarily due to the attractiveness of the lower price of the imported product (Del Moral & Murillo, 2015; Márquez et al., 2004; Ríos & Castillo, 2015).
Table 1 Impact of exports and imports of beef in Mexico, 1990-2016 (thousands of tons and %) AAGR: Annual average growth rate
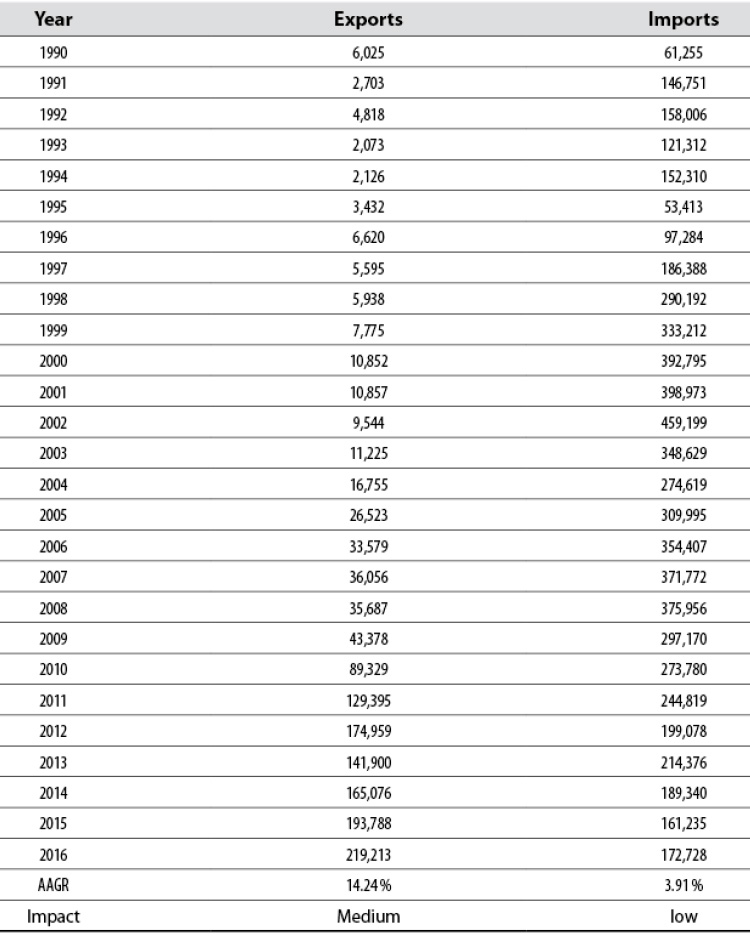
Source: Elaborated by the authors with information from FAOSTAT (2019)
According to the methodology proposed by Zahniser and Link (2002), during the analysis period, beef imports had a low impact (table 1); that is, they grew but to a lesser extent in reference to the criteria established.
Regarding exports, in 1990, around 6,025 tons were exported, and in 2016, 219,213 tons were exported, representing an average annual growth rate of 14.24 %, concentrating mainly on the US market (92 %) and, to a lesser extent (7.37 %), in Japan (Siavi, 2018). According to the behavior and growth of exports, it is observed that they had a medium impact.
The increase in exports is due in part to the regulations and innovations to which Mexican producers have been subjected to increase their market share, without yet exceeding the volume and value of imports, but supporting the reduction of the balance deficit livestock trade in recent years (Cavallotti, 2014).
Estimation of the competitiveness of Mexican beef
Although the contribution of Mexican exports of beef to the international market is minimal (0.5 % annual average during the analysis period), its growth has been notable in recent years, going from 0.11 % in 1990 to almost 2 % in 2016 (table 2). This dynamism is mainly because Mexican livestock has improved and technified its production processes, generating better quality meat through intensive livestock, strengthening and extending the value chain by increasing its participation in distribution, and adoption of international certification methods and health and safety standards, such as the Federal Inspection Type (TIF) trace model promoted by the federal government (Ríos & Castillo, 2015). In the international beef export market, countries such as Australia (16 %), the United States and Brazil (10 %), Ireland and the Netherlands (6 %), and France and New Zealand (5 %) stand out, adding in together 65 % of the world export volume (FAOSTAT, 2019).
Table 2 Competitiveness indicators of Mexican beef in relation to the world, 1990-2016
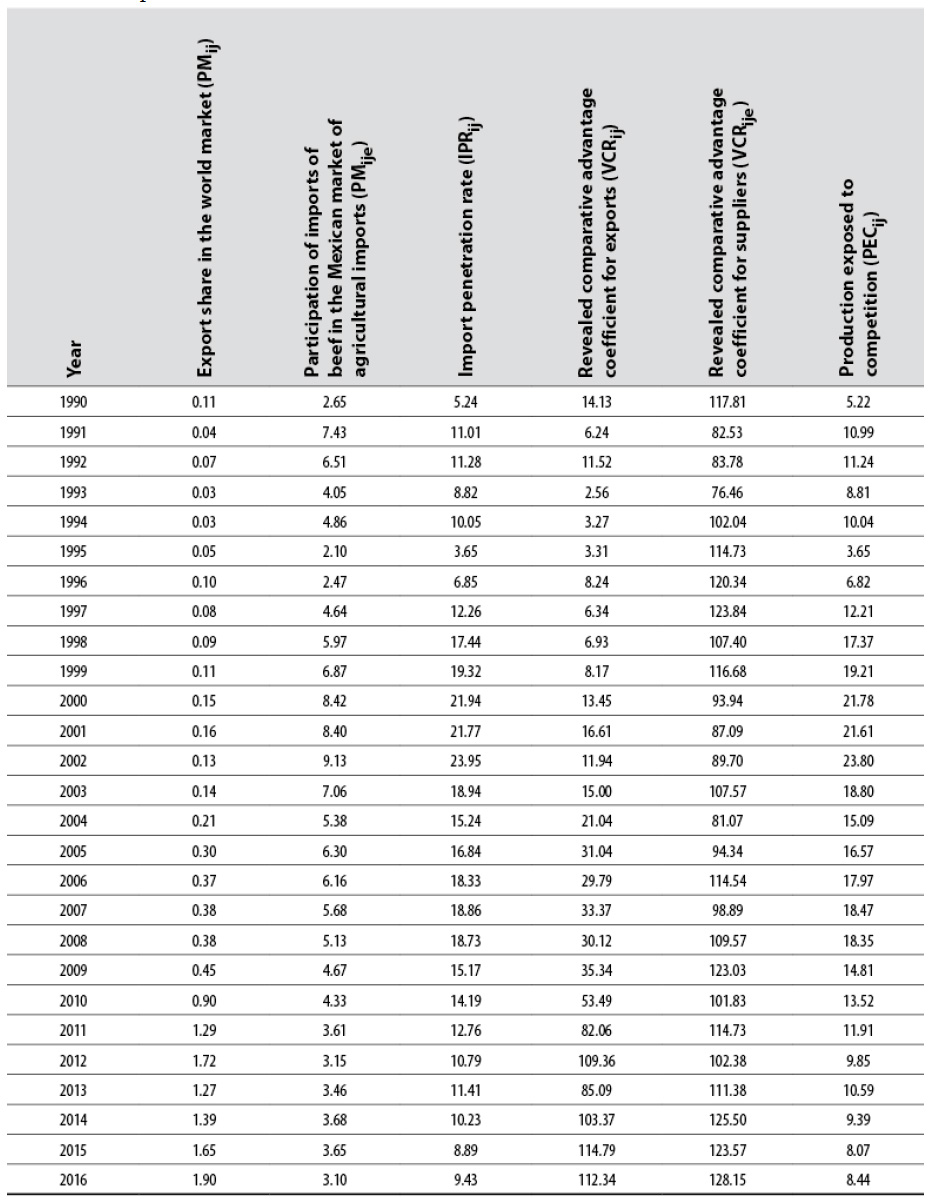
Source: Elaborated by the authors with information from FAOSTAT (2019)
The analysis shows that in 1990, beef imports represented 2.65 % of the total Mexican agricultural imports. However, in some years (2000, 2001, and 2002), values of 8.42, 8.40 and 9.13 % were reached. Since that date, there has been a significant decrease, contributing in 2016 only with 3.10 %, which places it as the fourth most imported agricultural product, after maize, soybean, and wheat (FAOSTAT, 2019).
In the apparent national consumption of beef, imports participated in 1990 with 5.24 %. In 1994, the year NAFTA came into force, imports represented 10.05 %, reaching more than 20 % of the national market from 2000 to 2002. In subsequent years, there was a decrease in imports, participating in 2016 with 9.43 % of the domestic market. The behavior mentioned above allowed supplying and complementing the national offer through imports, indicating greater dependence from overseas (Cruz & García, 2014).
The behavior of these indicators, of the participation of beef imports in the world market and the import penetration rate, shows the decrease in the participation of imports in the Mexican market throughout the study period, which could be attributed to two main factors: 1) the increase in national production, which presented an average annual growth of 1.95 % during the analysis period (FAOSTAT, 2019), and 2) the decrease in per capita bovine meat consumption, favoring the consumption of other types of proteins of animal origin considered healthier and displacing the imports of beef from the Mexican market (FAOSTAT, 2019).
The revealed comparative advantage of imports (suppliers) shows a growing trend with high competitiveness values, indicating the prevalence of imports over exports of beef in the Mexican market. In this market, the principal trading partner of Mexico is the United States, a country that has implemented aggressive policies to support exporters that, added to the weakness of the Mexican peso/dollar exchange rate, makes Mexico an accessible market (Del Moral & Murillo., 2015).
To estimate the indicator of Mexican production exposed to international competition, the vigorous commercial exchange in this market with the United States was considered. The competitiveness of this product maintains a decreasing trend during the analysis period, reaching its maximum level in 2002 with 23.8 %, while for 2016, it is reported at 8.44 %. This shows less exposure of the production to international competition, basically motivated by the decrease in imports.
On the other hand, the revealed comparative advantage of Mexican bovine meat exports in the world with respect to agricultural products, indicates that at the beginning of the period, competitiveness was 14.13 %. However, after the entry of NAFTA and during the crisis in Mexico in 1995, it decreased to 3.31 %. Starting in 2000, Mexican beef competitiveness reached double digits once more, increasing steadily due to the activities of companies such as Consorcio Dipcen, S. A. de C. V., Procesadora y Empacadora de Carnes del Norte (Don Fileto), Rancho El 17, and SuKarne (SE, 2020), which have managed to enter the markets of the United States, Japan, South Korea, Russia, Singapore, and Angola, based on the implementation of the required health, safety and certifications protocols for those markets. In contrast, the US and Canada have lost competitiveness in beef export (Omaña et al., 2014).
In Mexico, economic openness and the lack of support to the livestock subsector with public policies aimed at strengthening national production, promoted the substitution in the market of national goods with foreign products, fulfilling one of the objectives of trade opening: to generate competition and have better goods at a good price, in detriment of national producers.
For Mexico, the decrease in imports of beef and the increase in the competitiveness of exports shows an area of opportunity to strengthen national production, which requires supplying two markets: domestic and international. It is necessary, however, to implement various strategies to take advantage of this opportunity: strengthen and expand the federal inspection type slaughter infrastructure to guarantee safe and healthy products for consumers; promote the consumption of beef as a healthy option for the Mexican population; diversify the offer of beef products, append added value in packed, marinated, shredded, and precooked meat processes, among others, that facilitate the commercialization and extend the shelf life of Mexican beef in the global market.
Conclusions
In Mexico, trade liberalization has favored beef import largely, which allows complementing the national supply. However, Mexican exports grew considerably but not enough to offset the imports that caused deficits in the trade balance.
On the one hand, the displacement of beef imports from the market and the increase in the competitiveness of Mexican exports provide Mexican producers with the opportunity to obtain a higher share of the national market. Conversely, its participation in the world market is expanded, thus, confirming the research hypothesis: it is necessary to formulate public policy aimed at strengthening activities such as the production for beef export, through the adoption of standards and robust certification schemes, endorsed by the federal government. Such a formulation would have positive effects not only for the growth of this activity, but also in counteracting the implications of a growing deficit in the trade balance.

