


 Inglês (pdf)
 Artigo em XML
 Referências do artigo
 Enviar este artigo por email
 Citado por SciELO
  Citado por Google
  Similares em
SciELO
Similares em
SciELO  Similares em Google
 Permalink
Introduction
Due to the marked seasonality, pastures dedicated to cattle production in Venezuela show limited quality and amount of dry matter available to animals. They are characterized by their low nutritional value, particularly their low crude protein (CP) concentration, and high neutral and acid detergent fiber contents (Bello-Faria et al., 2021; Parada-Sánchez & Mora-Luna, 2019). One of the nutritional strategies to correct the forage protein deficit is the inclusion of non-protein nitrogen (NPN) sources in the diet, mainly urea (46 % N, 287.5 % CP). The first report of the use of this ingredient in Venezuela dates back to the 1970s, with results including improved weight gain and nitrogen (N) retention (Chicco et al., 1971, 1972; Shultz et al., 1978), and increased ammonia nitrogen, acetic acid, and nitrogen microbial concentrations in the rumen (Chicco et al., 1972; Shultz et al., 1974, 1978).
The rapid hydrolysis of urea to ammonia in the rumen could lead to an asynchrony with the available energy for the microorganisms (Salami et al., 2021), with the subsequent loss of efficiency of the available N for microbial protein synthesis (Lu et al., 2019). For this reason, since the same decade of 1970, technologies began to be developed worldwide for producing “slow-release urea” (SRU) (Owens et al., 1980). Those technologies included complexing urea with carbohydrates (Shultz et al., 1972), carboxy resin (Huston et al., 1974), sodium bentonite (Britton et al., 1978), formaldehyde treatment (Pal & Negi, 1977), and coating urea with oils (Owens et al., 1980). One product that uses the latter is Optigen II® (Alltech Inc. Nicholasville, KY, USA), in which urea is evenly coated with a semi-permeable vegetable fat matrix containing 88 % urea (41 % N, 256 % CP) and 11-12 % fat (Salami et al., 2020).
Several papers have described the effects of Optigen II® on nutrient intake and its digestibility (Corte et al., 2018; Gadegaonkar et al., 2018), ruminal fermentation (Gonzalez-Munoz et al., 2019; Mota et al., 2022), N balance (El-Zaiat et al., 2022; Miranda et al., 2019), carcass characteristics and meat quality (Corte et al., 2018), and milk’s yield and chemical composition (Herrera-Angulo et al., 2017; Miranda et al., 2019). In the works above, the response to SRU has been variable, with contrasting results when SRU replaced either soybean meal or urea.
Animal response to different feeding strategies can be evaluated through blood biochemistry, which reliably reflects the balance between the input and output of nutrients and their metabolism in the animal tissues (Wittwer, 2018 a, b). Nevertheless, there are few published studies about the SRU effects on the blood parameters of dairy cattle grazing tropical pastures. Therefore, the objective of the present work was to evaluate the effects of dietary supplementation with two NPN sources, urea, and Optigen II®, on the metabolic profile (energy, protein, and liver) of F. Holstein × Zebu lactating dairy cows under grazing conditions in the western Llanos of Venezuela. It was hypothesized that SRU supplementation could improve the metabolic profile by enhancing ruminal synchronization between energy and N of the diet, decreasing blood urea and hepatic enzymes, and reducing the ketone body’s production.
Materials and methods
The experiment was carried out in the western Llanos of Venezuela at the Mata de Mamón farm belonging to the Agropecuaria ASUBRI SA, located at Santa Bárbara de Barinas, Barinas state. The study followed the guidelines and recommendations for the Use of Animals in Teaching and Research of the Code of Bioethics and Biosafety of the National Science and Technology Fund [FONACIT] (2002) of Venezuela. Thirty-one F. Holstein × Zebu multiparous cows averaging 419 ± 46 kg of body weight, 51 ± 18 days in milk, and 17.1 ± 3.3 kg·animal·d-1 of milk yield were randomly assigned to one of two experimental groups: 1) ad libitum grazing + concentrate + 59 g·animal·d-1 of urea (UREA hereafter), and 2) ad libitum grazing + concentrate + 64 g·animal·d-1 of Optigen II® (SRU hereafter). Both NPN supplements provided 160 g CP·animal·d-1 and were individually fed in two equal parts at milking times. Simultaneously, 2 kg of commercial concentrate (15 % CP) were offered per animal (4 kg·d-1). Cows were milked twice daily at 04:00 and 16:00 h with mechanical milking, and the experiment lasted 91 days.
The animals were kept, as a whole group, under grazing conditions (2.12 AU·ha-1) in a rotational system with 1 day in and 32 days out of the paddocks, in pastures with Urochloa decumbens, U. humidicola, and U. brizantha. All animals, previous to milking, had free access to a mix constituted by 108 g·animal·d-1 of a mineral mix (%: 18.6 Ca; 4.02 P; 7.96 Mg; 2.96 Na; 0.15 Cu; 1.42 Zn; 0.4 Fe, and 0.4 Mn), 60 g·animal·d-1 of cane molasses, and 108 g·animal·d-1 of bypass fat (Bio-Lac®, Agrominerales, Venezuela) (g·100 g-1 of fatty acids: 440 palmitic acids, 400 oleic acids, 95 linoleic acids, 50 stearic acids, and 15 myristic acids). Before the experiment started, the cows’ diet consisted of grazing, concentrate feed, and mineral mix, which were maintained throughout the trial.
The experiment was carried out between October and January. Information related to forage mass and chemical composition (Table 1) was described by Herrera-Angulo et al. (2017). Rainfall during the experimental period was 66, 12, 42, 11, 11, and 5 mm, respectively, for 1-14, 15-28, 29-42, 43-56, 57-70, and 71-91 days of the experiment.
Table 1. Forage mass and chemical composition during the experiment
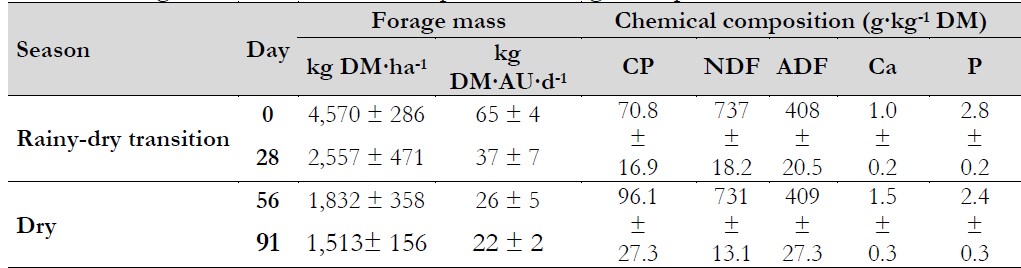
Notas aclaratorias:dry matter. AU: animal unit
Source: Adapted from Herrera-Angulo et al. (2017).
Blood samples were taken between 06:00 and 07:00 h (after morning feeding) on days 0, 28, 56, and 91 of the experiment using jugular puncture with 21G×1” needles (BD Vacutainer®, USA) and deposited into tubes without anticoagulants (Vacuum Diagnostics®, 6 mL, China). After clotting at room temperature, blood samples were centrifuged (IEC Centrifuges, Model Clinical, USA) at 915 × g for 15 minutes. The serum obtained was transferred via aspiration into plastic tubes. Serum samples were kept in ice boxes and carried to the Laboratory of Research of Physiology and Animal Health at the National Experimental University of Táchira (UNET) and stored at -20 °C (Bosch® Model GSD32, Germany) for further analysis. Glucose, cholesterol, total protein (TP), albumin, β-hydroxybutyrate, aspartate aminotransferase (AST), and gamma-glutamyl transferase (GGT) were determined according to the methods, commercial kits, and wavelength described in Table 2. Absorbance readings were taken using an OMEGA IV spectrophotometer (OMEGA IV, USA).
After outlier deletion, the intra-class correlation coefficient was determined. The data were analyzed using the MIXED procedure of SAS® (“SAS® OnDemand for Academics”) according to a complete randomized design with repeated measures (Stroup et al., 2018). The statistical linear mixed model was:

Where: Yijk is the response at time k on animal j in treatment i, μ is the overall mean, Diis the fixed effect of treatment i, Aijis the random effect of animal j in treatment i, T.is the fixed effect of the collection time k, (D×T)ik is the fixed interaction effect of treatment . with the collection time k, and Eijk is a random error at time k on animal jin treatment i. The SP(POW) (spatial power law) covariance structure for unequally spaced repeated measures was used (Stroup et al., 2018). Orthogonal polynomial contrasts for unequally spaced measures were used to determine the linear and quadratic effects of the collection time. Differences were declared statistically significant at p < 0.05 with a Bonferroni adjustment for the number of response variables (0.05/8 = 0.00625) (VanderWeele & Mathur, 2019). The PLM procedure of SAS and the Tukey-Kramer test were used when there was a significant interaction.
Table 2. Methods, commercial kits, and wavelength used for blood metabolite determinations
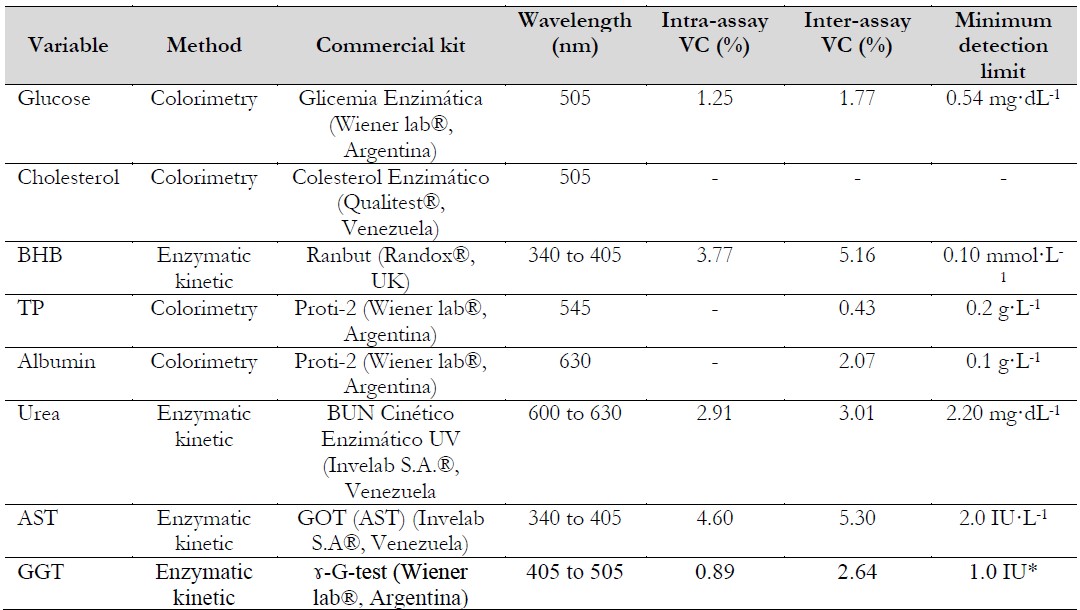
Notas aclaratorias:β-hydroxybutyrate. TP: total protein. AST: aspartate aminotransferase. GGT: gamma-glutamyl transferase. VC: variation coefficient. *Minimum detectable activity change.
Source: Prepared by the authors.
Results and discussion
Energetic profile
There was no influence of either the NPN source (p = 0.376) or collection time (linear p = 0.071, quadratic p = 0.240) on glucose concentrations, and no interaction between NPN and collection time was observed (p = 0.671) (Table 3). Average glucose concentrations remained within the normal range of 45-74 mg·dL-1 (Wittwer, 2018b). These results are similar to other findings when SRU was compared to either UREA (Kraisoon et al., 2018) or soybean meal (El-Zaiat et al., 2022) in the diet of lactating dairy cows. The authors noted that bovine glucose concentration remained within physiological ranges and without differences in their concentrations due to the protein source.
Table 3. Effect of the supplementation with two non-protein nitrogen sources on energetic profile
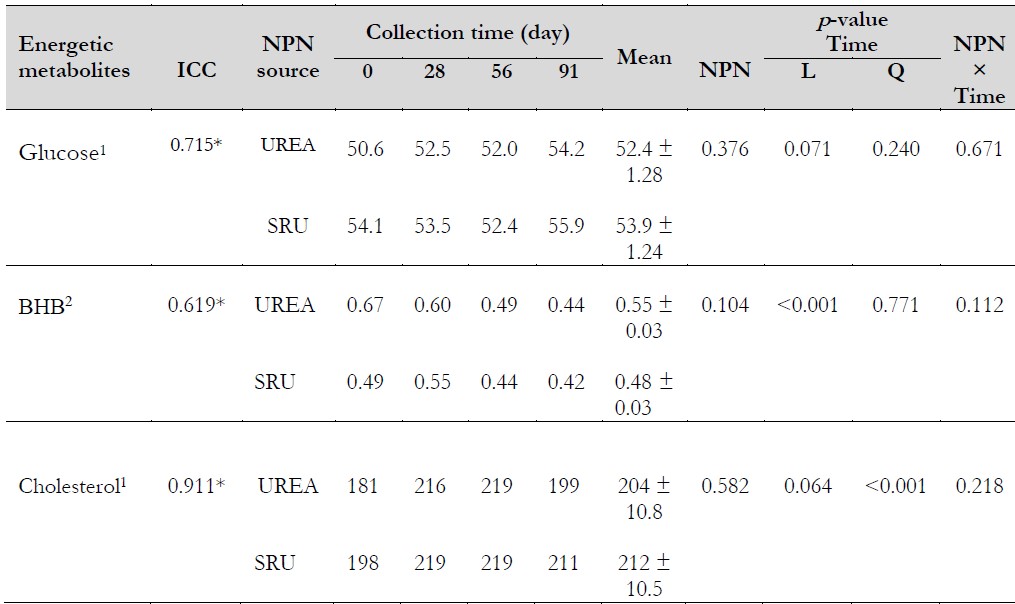
Notas aclaratorias:1mg·dL-1, 2mmol·L-1. *p < 0.05. BHB:β-hydroxybutyrate. ICC: intra-class correlation coefficient. NPN: non-protein nitrogen. SRU: slow-release urea. L: linear; Q: quadratic.
Source: Prepared by the authors.
The NPN source (p= 0.104) or NPN source × collection time interaction (p = 0.112) did not affect BHB concentrations (Table 3). Kraisoon et al. (2018) and El-Zaiat et al. (2022) also observed no effect on BHB when SRU was used in the diet of lactating dairy cows. Herrera-Angulo et al. (2017) evaluated the productive performance of these cows, and no differences were observed in the body score condition and the average daily gain due to the NPN supplied. Being the BHB an indicator of body reserve mobilization, the similarity in their concentrations among treatments coincides with the abovementioned response in the body score condition and the average daily gain (data not presented).
The collection time influenced the BHB concentrations, decreasing linearly (. < 0.001) during the experiment with values of 0.58, 0.57, 0.47, and 0.44 mmol·L-1 for 0, 28, 56, and 91 days, respectively. This decrease can be due to the body reserve mobilization (Rodriguez et al., 2021) since between 0 and 28 days, the animals were at the milk yield peak, which is between 45-56 days postpartum in crossbred dairy cows (Ali et al., 2021; Bangar & Verma, 2017). The BHB values observed were lower than 1.2 mmol·L-1, considered the threshold in lactating dairy cows. A value greater than this indicates high body reserve mobilization and the occurrence of clinical ketosis (Benedet et al., 2019).
There was no effect of either NPN source (p= 0.582) or NPN source × collection time interaction effect (p = 0.218) on cholesterol concentrations (Table 3). Mazinani et al. (2023) also observed no difference in the cholesterol concentrations between UREA and Optigen in dairy goats. From day 28, both the groups showed average values above the reference range (104-205 mg·dL-1) considered by Wittwer (2018a). These higher cholesterol concentrations can be due to the bypass fat inclusion in the diet (108 g·animal·d-1). Cholesterol increases have been observed in dairy cows when bypass fat is offered, and this increase is evident after 7 days of supplementation (Waghmare et al., 2016).
The collection time affected the cholesterol concentrations (p < 0.001), showing a quadratic response (p < 0.001; y = -0.0114x. + 1.1842x + 190.97), with values of 190, 218, 219, and 205 mg·dL-1 for 0, 28, 56, and 91 days, respectively. The maximum cholesterol concentration was 222 mg·dL-1 on day 52. At this time, the cows showed an average of 103 days in milk. Walter et al. (2022) and Kessler et al. (2014) observed lower cholesterol concentrations at the beginning of lactation and increased steadily the remaining lactation after that. This variation in the cholesterol concentration in lactating dairy cows is due to changes in serum lipoprotein concentrations during lactation (Raphael et al., 1973).
Protein profile
There was no influence of the NPN source on urea concentrations (p = 0.403), and no interaction between NPN and collection time was observed (Table 4) (p= 0.298), with an overall mean of 38.4 mg·dL-1. Similar results were reported by Miranda et al. (2019) and El-Zaiat et al. (2022). The lack of treatment can be due to the low energy availability in the rumen. When there is an imbalance between the energy intake and ruminal degradable protein, caused by a limited provision of energy, the concentration of ruminal NH.-N increases since the capacity of the ruminal microbiota for using it is exceeded. Ammonia is then absorbed across the ruminal wall epithelium and converted to urea in the liver (Hailemariam et al., 2021). It is known that tropical grasses have low metabolizable energy content (Azevedo et al., 2021; Boschma et al., 2017; Wassie et al., 2019), and despite N ruminal degradability of Optigen II being lower compared to UREA (Sinclair et al., 2012), the low availability of energy in the rumen could have limited the NH3-N utilization and led to the similar serum urea concentration among treatments.
Collection time influenced urea concentrations (p < 0.001) showing a quadratic response (y = -0.004x2 + 0.5402x + 26.429), with values of 25.4, 41.4, 41.5, and 43.3 mg·dL-1 for 0, 28, 56, and 91 days, respectively. The maximum urea concentration was estimated at 44.7 mg·dL-1 on day 68. The decrease in blood urea from 68 days was possibly due to the low forage mass. Between 70-91 days, the forage mass decreased to 1,513 kg DM·ha-1 (Herrera-Angulo et al., 2017), which was less than 2,000 kg DM·ha-1, a value below which forage intake reduces (Minson, 1990), and therefore protein intake could also decrease. Urea concentrations were within the reference range Wittwer (2018a) reported until day 56 of the experiment (15.6-42.2 mg·dL-1) and slightly above at day 91.
The NPN source did not affect total protein (p = 0.460) and albumin concentrations (p = 0.214) (Tabla 4). Mazinani et al. (2023) reported that in dairy goats fed with UREA or Optigen, the concentrations of total protein and albumin were not affected. The same response was observed when Optigen partially replaced soybean meal in dairy cow diets (El-Zaiat et al., 2022).
Table 4. Effect of the supplementation with two non-protein nitrogen sources on protein profile
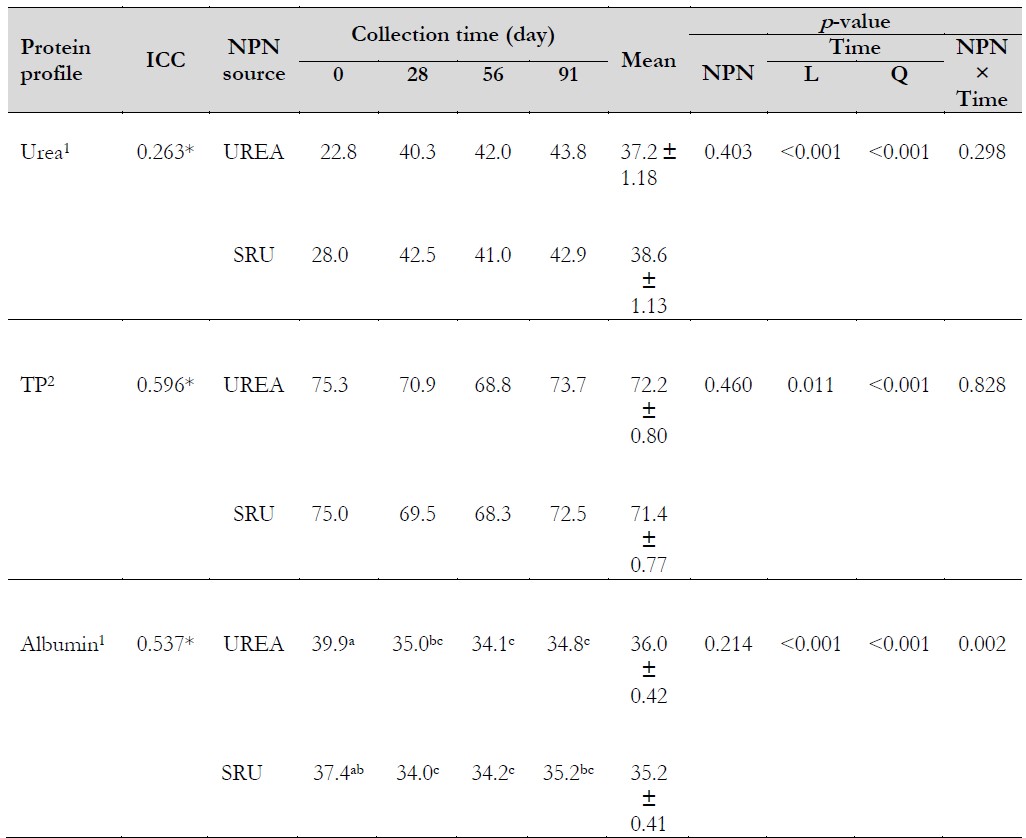
Notas aclaratorias:1mg·dL-1, 2g·L-1.*p < 0.05. TP: total protein. ICC: intra-class correlation coefficient. NPN: non-protein nitrogen. SRU: slow-release urea. L: linear; Q: quadratic. a, b, c Means with different superscripts are different.
Source: Prepared by the authors.
On the other hand, a collection time effect was found on both variables, showing a quadratic response (p < 0.001). Concentrations of total protein of 75.2, 70.2, 68.5, and 73.1 g·L-1 were observed for 0, 28, 56, and 91 days, respectively (y = 0.0026x2 - 0.2648x + 75.289), while albumin concentrations were 38.7, 34.5, 34.2, and 35 g·L-1 for the same sequence of days (y = 0.0014x2 - 0.1631x + 38.516). The minimum concentration of total protein was estimated at 68.5 g·L-1 on day 51, while for albumin, the minimum concentration was 33.8 g·L-1 on day 58. The total protein concentration decreases during lactation because of albumin decrease (Kaneko et al., 2008). Changes during lactation in total protein and albumin concentrations have been observed in dairy cows (Hussein et al., 2020). In addition, the interaction NPN × collection time (Table 4) influenced albumin concentrations (p = 0.002), being different at day 0, with greater values in UREA and a decrease in both treatments from day 28. Differences at day 0 were not due to the treatment effect. During the experimental period, total protein and albumin average concentrations were within the reference range 66-90 and 29-41 g·L-1, respectively (Contreras, 2018).
Hepatic profile
Regarding AST and GGT, there was no influence of either the NPN source (p = 0.713 and 0.727, respectively) or NPN source × collection time interaction (p = 0.150 and 0.937, respectively) on the activity of these enzymes (Table 5), with overall means of 117.4 and 28.3 IU·L-1, for AST and GGT, respectively. In the present work, 64 g·d-1 of SRU were supplied, and Baimishev et al. (2018) observed in high-producing cows that the use of 80 g·d-1 of Optigen did not influence AST activity; however, greater amounts than this increased the AST and alanine aminotransferase activities.
Table 5. Effect of the supplementation with two non-protein nitrogen sources on hepatic profile
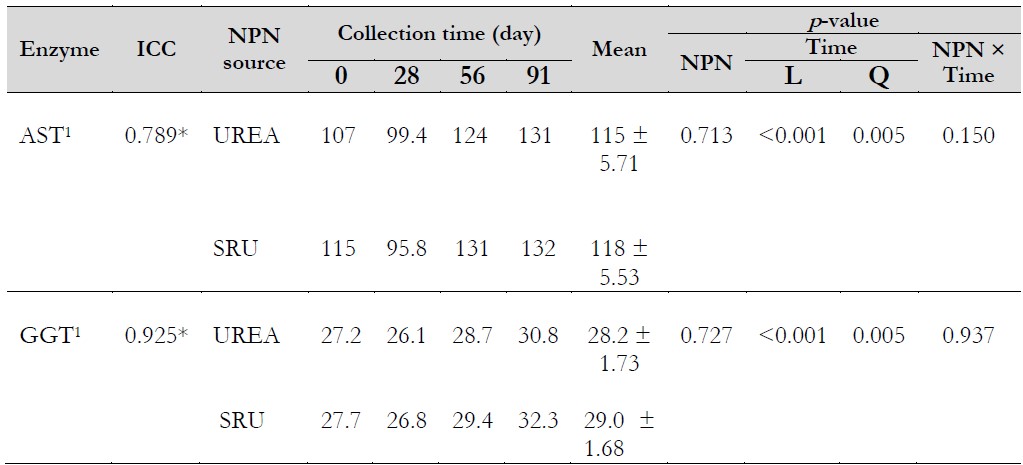
Notas aclaratorias:1IU·L-1.*p < 0.05. ICC: intra-class correlation coefficient. AST: aspartate aminotransferase. GGT: gamma-glutamyl transferase. NPN: non-protein nitrogen. SRU: slow-release urea. L: linear; Q: quadratic.
Source: Prepared by the authors.
The collection time affected the activity of these hepatic enzymes (Table 5) with a quadratic response (p = 0.005), with 111, 97.6, 127, and 131 IU·L-1 (y = 0.0035x2 - 0.024x + 107.02) for AST, and 27.5, 26.5, 29.1, and 31.5 IU·L-1 (y = 0.0008x2 - 0.0225x + 27.247) for GGT for 0, 28, 56, and 91 days, respectively. For the same order of enzymes, the minimum values of AST and GGT were estimated at 107 and 27 IU·L-1, respectively, on days 3 and 14. Now, cows had 54 and 65 days in milk, respectively. The results are in line with Cozzi et al. (2011), who identified greater values of AST and GGT in mid-lactation cows (90-125 days) when compared to early-lactation cows (10-89 days). Nonetheless, no reports were found in the literature that explain the causes of these increases during lactation. AST and GGT average concentrations during the experimental period were lower than threshold 120 (Wittwer, 2018a) and 40 IU·L-1 (Johnston et al., 2014), respectively. Values greater than those would indicate an impairment of liver function (Mordak et al., 2020). Finally, the lack of effect of the NPN source on blood parameters was in line with the findings of Herrera-Angulo et al. (2017) in these same cows, where differences in milk yield, milk protein and fat yield, milk urea, average daily gain, and changes in body score condition were not observed.
Conclusions
The blood indicators of energy and protein metabolism and hepatic functionality did not differ between UREA and SRU; hence, the Optigen II® did not offer an advantage over the commonly used urea supplement. However, we recommend further research regarding SRU use, evaluating carbohydrate sources of fast and intermediate ruminal degradation in the concentrate of lactating dairy cows grazing low-to-medium quality tropical forage.
Authors’ contributions
Robert Emilio Mora-Luna: conceptualization, funding acquisition, methodology, project administration, resources, supervision, writing-original draft, writing-review & editing; Ana María Herrera-Angulo: conceptualization, funding acquisition, methodology, project administration, resources, supervision, writing-review & editing; José Fernando Eslava-Tovar: investigation, data curation; Juan Carlos Isea-Chávez: investigation, data curation; Aquiles Enrique Darghan: formal analysis.

