


 English (pdf)
 Article in xml format
 Article references
 Send this article by e-mail
 Cited by SciELO
  Cited by Google
  Similars in
SciELO
Similars in
SciELO  Similars in Google
 Permalink
1. Introduction
On a civil engineering project, a structural designer must guarantee that the structure must have an adequate behavior regarding the resistance and service, cost-effective and complies with the architectonic and construction requirements. To archive this, the engineer should go through a “manual process” that modifies iteratively the initial structural configuration, considering the stablished design codes and the experience of the designer. Typically, few iterations are made during the design process, therefor, the following question is valid: does the quantity of iterations made guaranties that the structural configuration is the lowest cost? A way to improve the quality of the design (in terms of cost-efficiency) consist in the automatization of the design process through the realization of the denominated Structural Optimization, which is divided in the following categories 1,2: I) element section optimization, II) material optimization, III) shape optimization and IV) topologic optimization.
The solution to the optimization problem requires the selection of a numerical technique capable of solving the current problem, in this case being the metaheuristics a group of optimization algorithms that has good performance 3-7. The metaheuristic is an approximate optimization algorithm used in the efficient determination of “adequate” solutions of difficult and complex problems in science and engineering, but it cannot guaranty an optimal solution 8. One of the most used metaheuristics is the genetic algorithm technique (GAs), which is based in the Darwin’s theory of natural selection and evolution of species. Various authors in literature have introduced modifications either to the structure of the algorithm or the representation of solutions with the objective of increasing the algorithm performance in the solution of the problem of optimizing trusses. One of them consist in the definition of group of elements assigned with the same cross-section 3 to reduce the variable of the problem (therefor, reducing the search space of the solution). Considering the computational cost, the usage of solution representation schemes different from that of the binary codification could reduce significantly the time needed for the optimization of structure with great numbers of variables 4. Additionally, improvements in the convergence process can be achieved by changing the way on how the violation of constrains is handled 5, the usage of initial populations generated heuristically 6 and the modification of the genetic operators (like in the case of the usage of a probabilistic operator for the selection 7), among other strategies. Non the less, the effect that the genetic parameters have over the optimization process of trusses have not been studied in depth, being that the values assumed on these parameters could affect de performance of the GA.
Generally, the selected GA parameters in truss optimization correspond to the values found by the researches that generated the best results after testing various parameter combinations. Non the less, there are 3 aspects that could indicate that the previous procedure is not the most adequate:
The GA should be run for every parameter combination, which increases the number of evaluations of the objective function (at the same time, each evaluation of the objective function requires a structural analysis).
A unique combination of genetic parameter is used for all analyzed trusses; although, there is no guarantee that the search space would be the same por each structure analyzed.
The values are kept constant throughout the search process, but the dynamicity of the process could require assigning different values in function of the stages in which the optimization process is.
Therefore, it would be recommended the usage of GAs with low levels of dependency from the parameters used, being that it could be possible the application of control techniques for the parameters, like the adaptive or self-adaptation 9. The present paper introduces a methodology for the three-dimensional steel trusses based on genetic algorithms, but that does not require the definition of genetic parameters from the user. In this manner the proposed methodology could be applied directly to any truss (under the constrain presented in this paper) without being necessary a previous calibration of the genetic paraments. Finally, from the obtained results it can be determined if the search space is unimodal or multimodal.
1.1. Genetic Algorithms
The GAs are a type of optimization algorithm proposed by John Holland on 1975 10, the GAs evolve a population of possible solution through mathematical operations based on the principle of reproduction and survival of the fittest of Darwin.
The application of a GA to an optimization problem requires the definition of a representation scheme (binary, real, combination, among others) of the possible solutions. A possible solution is codified through a vector called chromosome, with each of the design variable corresponding to a section of this vector (gen). Then, it must be defined the genetic operators used in the transformation process (evolution) of the population and the genetic parameters that condition the application of the operators. The size of the population must be defined by the user.
The iterative process starts with either the heuristic or random generation of the initial population. The random generation requires that the process of generating random numbers is defined between the range of values of each variable, while the heuristic form implies that the knowledge of the characteristics of the problem must be used in the generation of the individuals of the population to accelerate the search process. Then, the genetic operations are applied in a consecutive manor: I) Selection, II) Reproduction and III) Mutation. The Selection choses the best individuals of the population considering the value of their fitness (measured in terms of the objective function).
In the Reproduction o Crossover two new solutions are generated from the combination of two individuals chosen by the selection process. Finally, the Mutation alters randomly the characteristics of some individuals with the aim of introducing diversity to the population. The frequency on which the last two operators occurs must be limited through parameters know as Crossover Rate and Mutation Rate. Additionally, we can implement Elitism to preserve the best individual between two successive generations. The application of the previous operations creates a new population of individuals that is expected to be better than their predecessor. This process is repeated iteratively until a convergence criterion is reached (example, maximum number of generations). Given that the algorithm is stochastic, it is required that it must be executed multiple times before giving an answer to the user.
2. Methodology
In Figure 1 the flowchart shows the proposed methodology for the optimization of the structural designs of the trusses. The process starts by reading the initial data of the trusses (node location, element description and materials, loads, etc.). Next, the initial population of solutions is generated, where each of the individuals corresponds to a determined structural design, by assigning randomly to each element (or group of elements) a cross-section from an available set of options. Then a finite element analysis is run for each structural configuration to determine the reactions of the structure (in terms of element’s stresses and displacements in the nodes) under the effect of solicited loads.
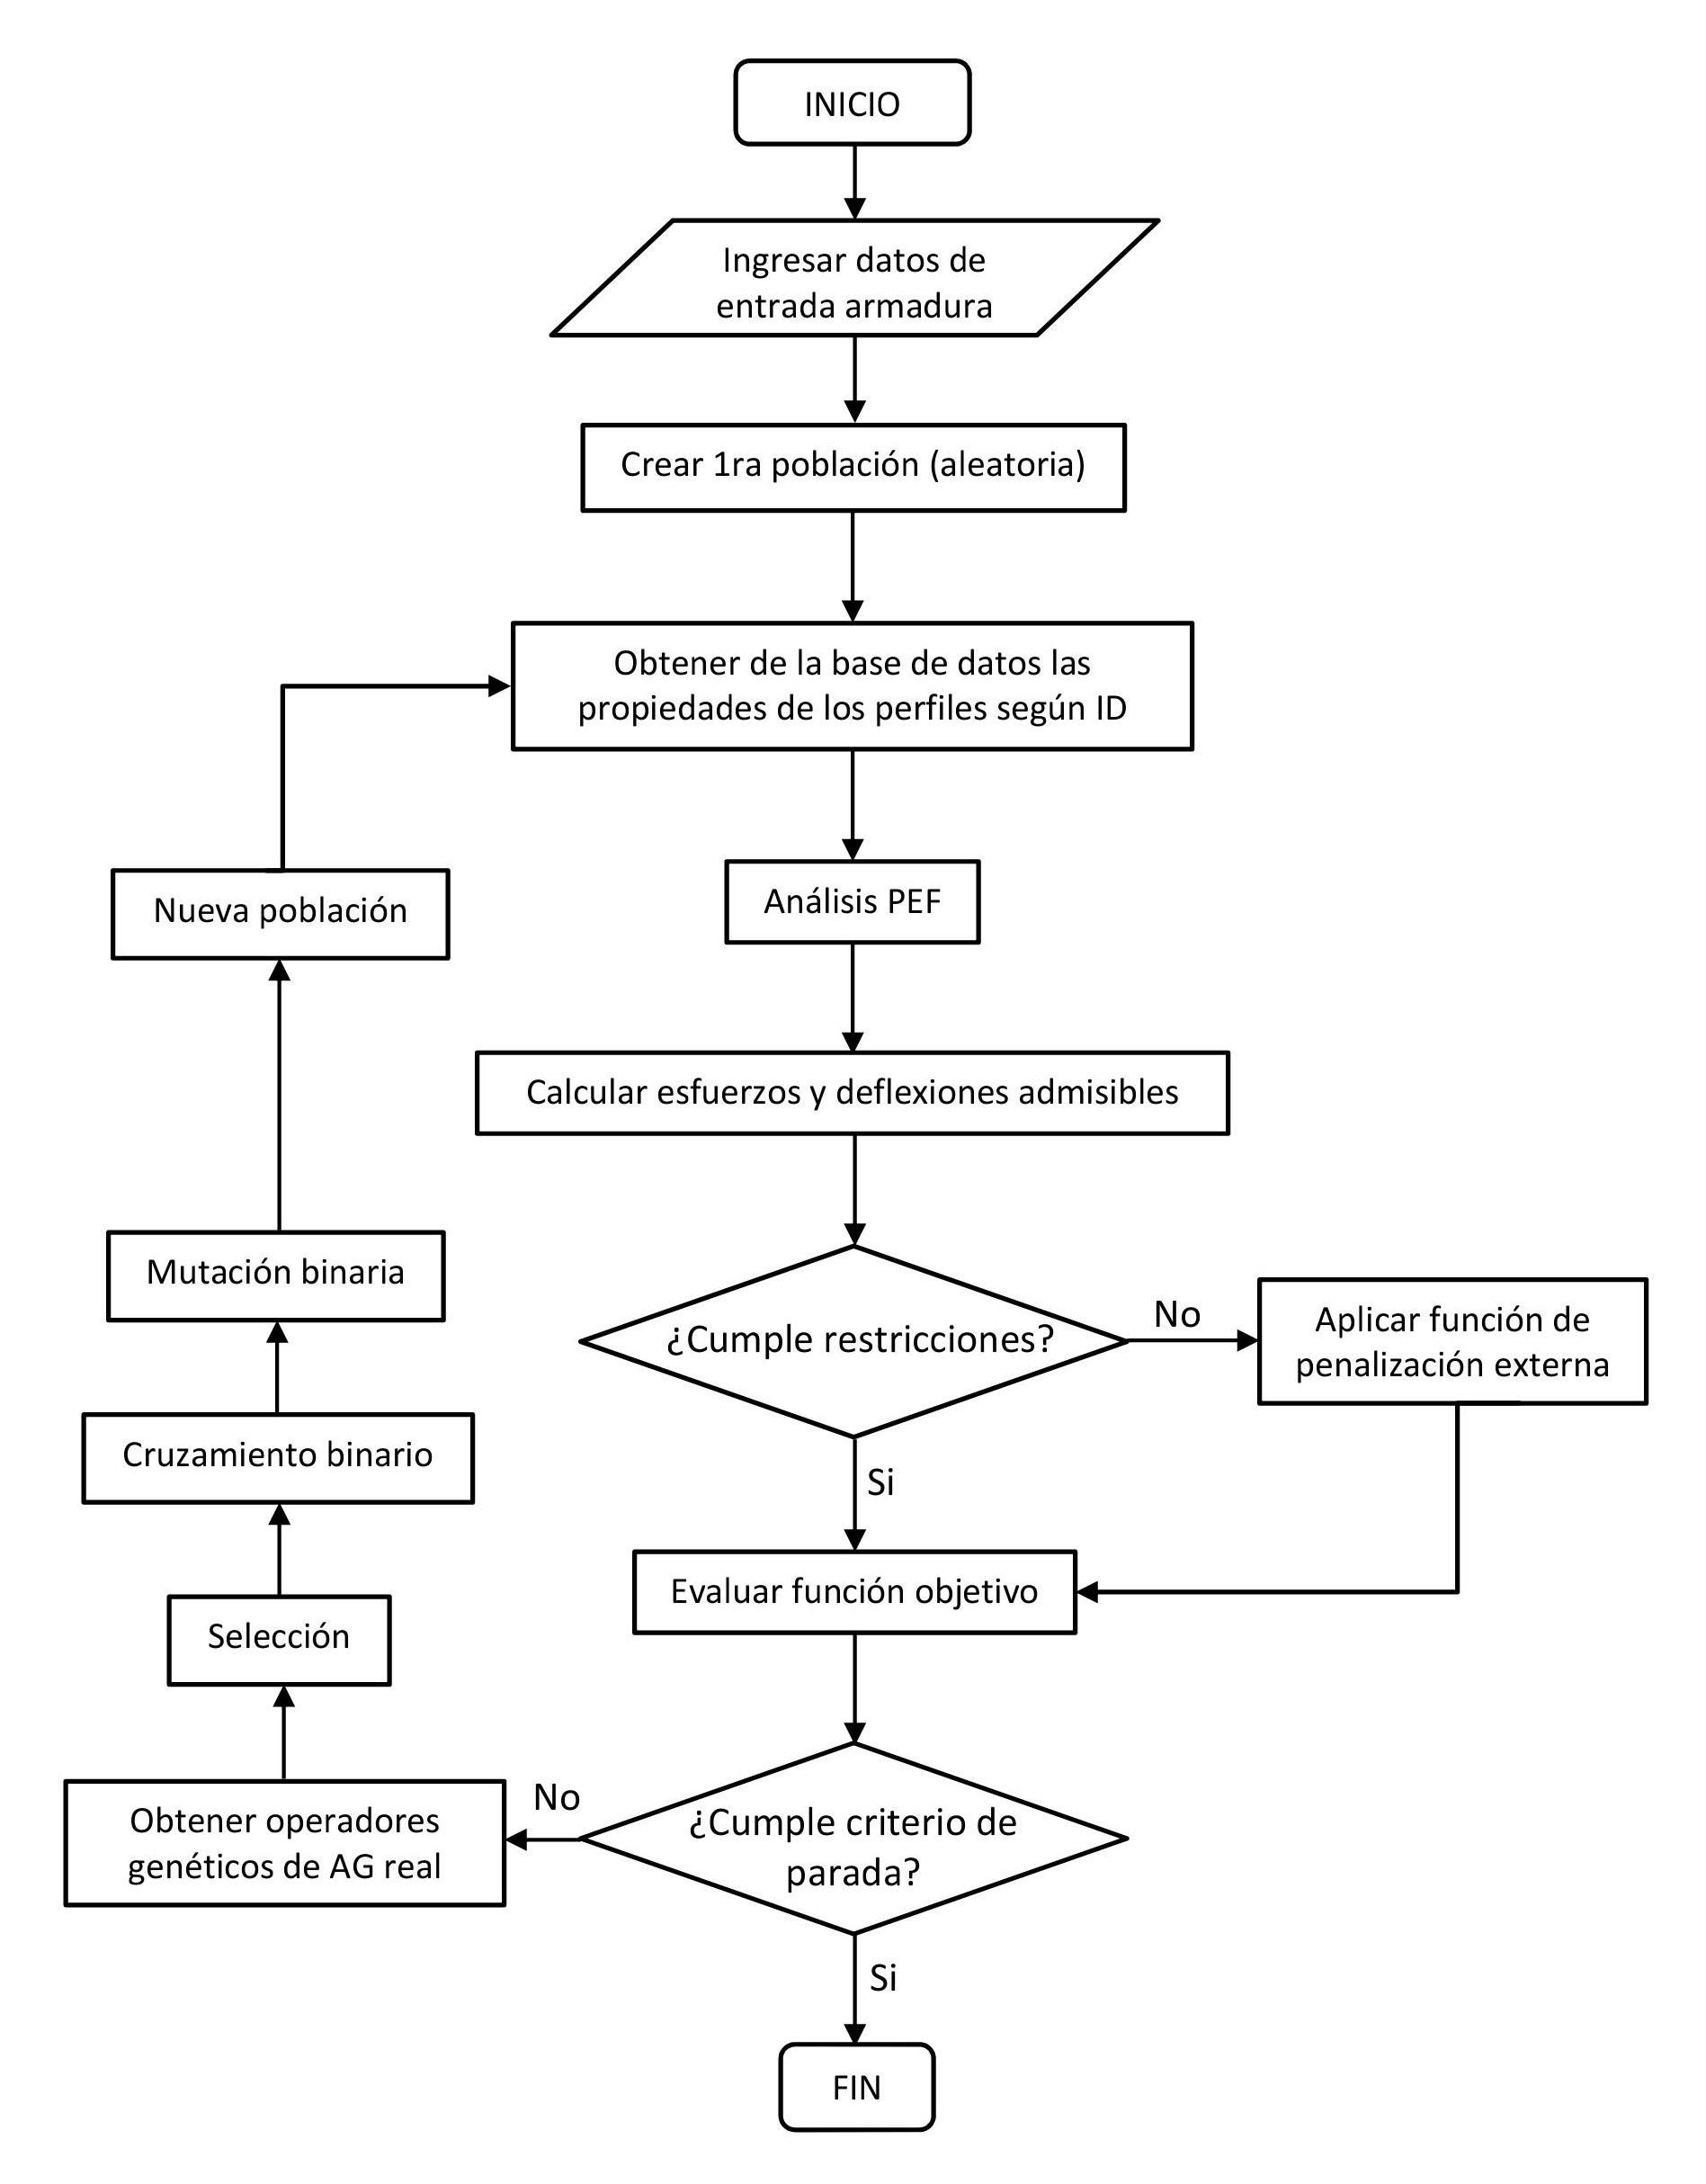
Given the previous information the following steps carry out: I) Evaluation of the self-weight of each individual (structure), II) Verification of the constrain set in section 2.1, to establish if the design is viable or not, and III) Penalty of the cost of the solution following the criteria given in section 2.3, if the structural configuration violates any constrain. On this part, the criteria to stop the algorithm are evaluated, which are: I) a maximum number of allowed iterations and II) specific quantity of iteration where the fitness of the best induvial does not considerably change. If one of the criteria does not comply, a new solution is created through the operators detailed in section 2.2; on the contrary, the algorithm stops it execution and shows most cost-effective structural design found.
2.1. Problem Formulation for the Structural Optimization
In this section the characteristics of the problem in study are defined in terms of design variables and parameters, objective function and constrains. In that sense, the variable of the design problem corresponds to the properties of the cross sections of the elements (area), meanwhile the properties of the steel and the geometric configuration are kept constant during the evolutionary process. The objective function is configured in terms of the self-weight of the structure (W), shown in Ec. 1, and the constrains established in Ec. 2 to 4:
Minimize:
Subject to:
being, ρ the unit weight of steel (0.28 lb/in3), l i and A i the length and the cross-section area the element’s in group i, respectively, ng number of groups, δ j node displacement, j, δ max maximum allowed displacement, nj number of nodes, σ k maximum stress on the element k, σ adm maximum allowed stress on the element and nm number of elements in the structure. Aiu y Ail are the minimum and maximum values that the variables can take. Due to constructive constrains, it is not possible to assign an unique cross-section to each individual element in the structure, because of this, groups of elements are assigned with the same cross-section, producing one design variable per group. The reduction in quantity of design variables also leads to a reduction in the search space to consider less possible solutions.
The algorithm was implemented on the integrated development environment Eclipse ®, version Juno Service Release 2 complimented with JDK 1.7. (Java Development Kit), that includes the tools to develop, debug and monitor JAVA ® applications.
It is important to consider that the mathematical formulation defined in the paper was used with the objective of comparing the performance of the methodology proposed with other algorithm in the literature. Non the less, the model of physical constrain is limited due to the exclusion of important phenomena in the steel structural design like the susceptivity to buckling.
2.2. Configuration of Multi-chromosome Genetic Algorithm
A multi-chromosome GA (MCGA) is proposed to find the solution to the optimization problem established in section 2.1. The algorithm uses an especial representation for the individuals (Figure 2), which are constituted by two chromosomes: (I) one binary chromosome with Gray codification to represent the solution of the problem, in other words, a combination of sections and II) a real chromosome that allows to self-adapt the genetic parameters during the evolutionary process. Said representation allows to simultaneously establish adequate values for the cross-section of the structure’s elements and the genetic parameters required in each stage of the optimization process. The adaptation of the parameters is attached to each individual, this means that each parameter does not have one unique value through the optimization process, on the contrary, it varies through the process. From the above it is possible to diminish the algorithm success dependency from the values of the parameter defined by the user, which is present in the traditional approach with constant parameters for all the population. And so, the success of the algorithm is evaluated from the solution found and considering the reduction in the number of objective function evaluations, which is obtained as a consequence of the elimination of the trial and error process used to calibrate the genetic parameters.
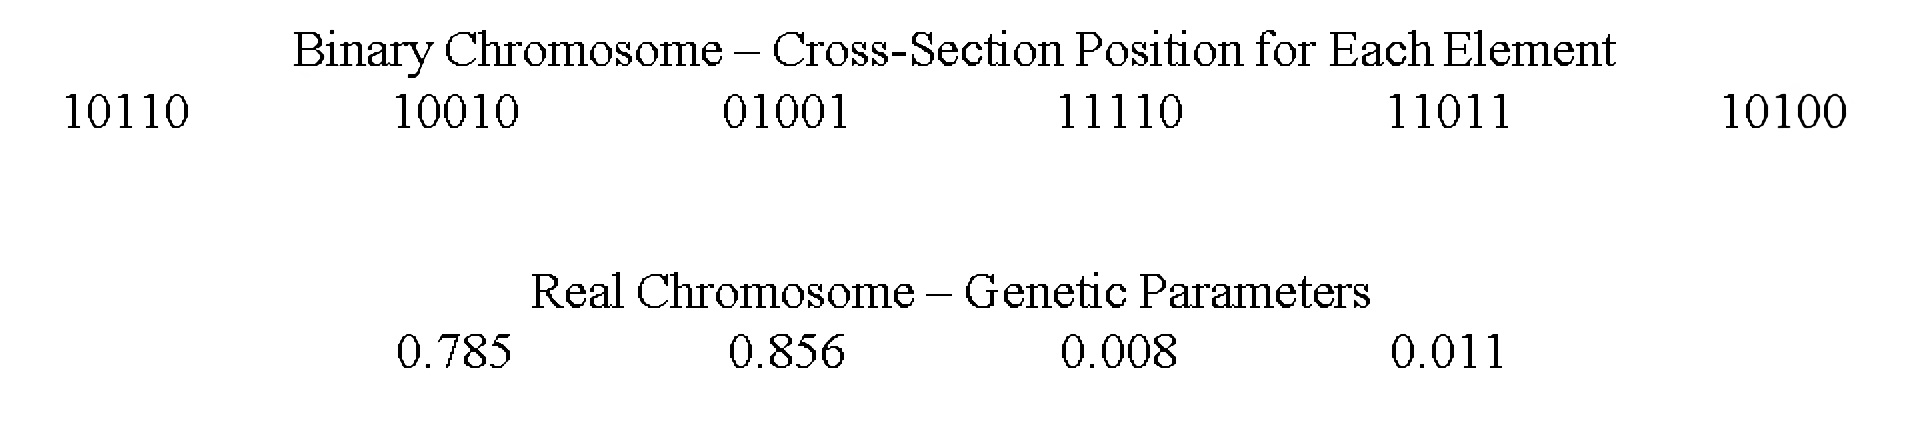
The Figure 2 shows an example of an individual that represents a 3D truss with 6 groups of elements. Each of the columns of the binary chromosome indicates the codification of cross-section to be assigned to each element, starting with group 1 (left end) and ending with group 6 (right end). Considering that a data base of 30 sections requires 5 binary digits to represent any position in said data base, the elements 2 and 5 will take the cross-section 18 and 27 from the data base of profiles, respectively. Regarding the real chromosome, this is used to evolve the genetic parameters through the process. From left to right, the values correspond to cross rate and mutation rate for the real and binary chromosome, respectively. The proposed representation allows for the exact values of the different rates to no be defined by the user, but to establish intervals for the possible values (Table 1), expecting that the performance of the algorithm is in a lesser degree dependent of its parameters. These values were selected from the reference11 since it was shown to be adequate in the solution of another problem in the structural engineering field. In this manner, the performance of the methodology would be evaluated when the range of the values of the parameters does not require to be inputted by the user.
Table 1 Limits for the Genetic Parameters for the Solution 11
| Limit | Crossing | Mutation | ||
|---|---|---|---|---|
| Binary | Real | Binary | Real | |
| Inferior | 0.70 | 0.80 | 0.005 | 0.03 |
| Superior | 0.90 | 0.95 | 0.020 | 0.06 |
The next step for the MCGA configuration consists in selecting the genetic operator that will generate new solution form the current population. The selected operators were taken from the reference 11, like shown in Table 2, due to the effectiveness shown in said paper. The way of applying these operators to each type of chromosome (binary or real) can be found in classic texts of genetic algorithm, like shown in 12. A study of the effect of the usage of other operators was not made, since the focus of this research lies on the impact that the definition of genetic parameters has; non the less, it must be studied in future work to define de most adequate parameters for the problem.
Table 2 Genetic Operators for the Simulation 11
| Chromosome | Selection | Crossing | Mutation |
|---|---|---|---|
| Real | Tourney, n=3 | BLX- α α = 0.50 | Creep |
| Binary | Two points | Jump |
For handling the problems constrains, a penalization technique is used to transform the problem in a “non- restrained” one. In this manner, a dynamic penalization factor was included in the objective function to “punish” those solutions that violates the constrains. The scheme allows the increase of the penalization as the evolutionary process advances and given by Ec. 5 5:
where f is the objective function of the problem, x is the variable vector of the design, t is current number of the iteration, g is the penalization function and k are the magnifying factor for the penalization. The efficiency of the previous function is conditioned by the value of k. Erbatur et al. (5 took a value k = 10, while in the present study a value of k =15 is taken, with the objective of increasing the penalization of the worst solutions. Such as strategy tries to guide the search to a zone where the best solution for an individual could be found. This value was obtained by trial and error of tests with different values of k.
On this paper, a total of 50 runs of the GA was made for each of the examples studied, where the solution found corresponds to the best individual at the end of the evolutionary process. As a stopping criterion a maximum number of iterations was used, which was defined for each case studied. The solution provided to the user corresponds to the structural configuration the minimum self-weight among the set of good solutions.
2.3. Structural Analysis of 3D Trusses
The evaluation of the constrains requires that it must be known the internal forces of the elements and displacement of the structure that are caused by external loads. To manage this a program of lineal analysis for the structure using finite elements was developed on MatLab ®. The complement deplovtool was used to transform the MatLab ® code into a file package (function) JAVA ®, with the objective of connecting the codes. All the data entries (geometry, loads, constrains, connectivity, etc.) and element properties are read form an Excel ® spreadsheet. The program was configured by interfaces to manage a polymorphic behavior, so that the file reading mode stays open.
3. Numeric Examples
Two classic examples reported in literature were used to evaluate the performance of proposed methodology, in terms of the self-weight of the optimized structure and the number of evaluations of the objective function. In both examples the structure is made out of a material with a density of 0.1 lb/in3 (2678.8 kg/m3) and an elastic module of 10,000 ksi (68947.6 MPa). The results obtained are compared with those reported by diverse authors that have employed metaheuristic to resolve the same examples. Likewise, the diverse configuration of the elements that results from the last generations are analyzed to categorize the objective function in terms of the presence or lack thereof local optimums. Finally, the convergence process toward the final solution for the two examples will be observed. In relation with the optimization algorithm, 50 runs will be executed with 100 individuals and 250 iterations, values that were determined after trial and error tests.
3.1. Example 1: Spatial Trussing of 25 Elements
In Figure 3, the structural configuration for the spatial truss is shown, which has 25 elements, with a total of 18 degrees of freedom and 4 hinged supports. The elements were grouped so that only 8 possible different cross-sections maximum could be assigned (design variables). As shown in Table 3, generic sections are used using only the cross-section area, being that they vary in a discreet way between 0.1 (6.45E-5 m2) and 3.4 (2.19E-3 m2) every 0.1 in2 (6.45E-5 m2).
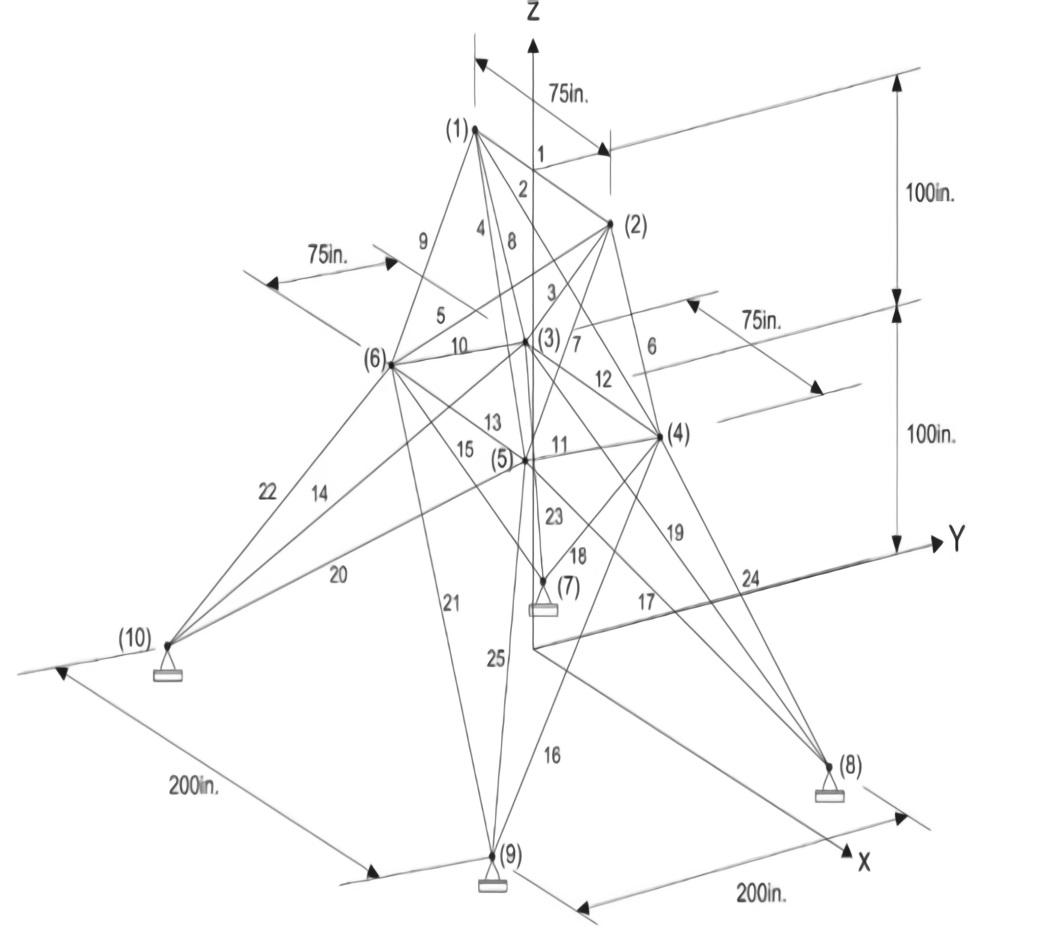
Table 3 Restrictions for the Truss of 25 Elements
| Design Variables (in2) | A1 | A2 | A3 | A4 | A5 | A6 | A7 | A8 |
|---|---|---|---|---|---|---|---|---|
| Compression stress limit ksi -MPa | 35.09- 241.93 | 11.59- 79.91 | 17.31- 119.35 | 35.09- 241.93 | 35.09- 241.93 | 6.76- 46.61 | 6.96- 46.61 | 11.08- 76.39 |
| Tension stress limit (ksi) | 40.00- 275.79 | 40.00- 275.79 | 40.00- 275.79 | 40.00- 275.79 | 40.00- 275.79 | 40.00- 275.79 | 40.00- 275.79 | 40.00- 275.79 |
Regarding the constrains, the maximum allowed displacement is 0.35 in (8.89E-3 m) in all direction and the limit stress are presented in Table 3. The loads assigned over the structure appears on Table 4.
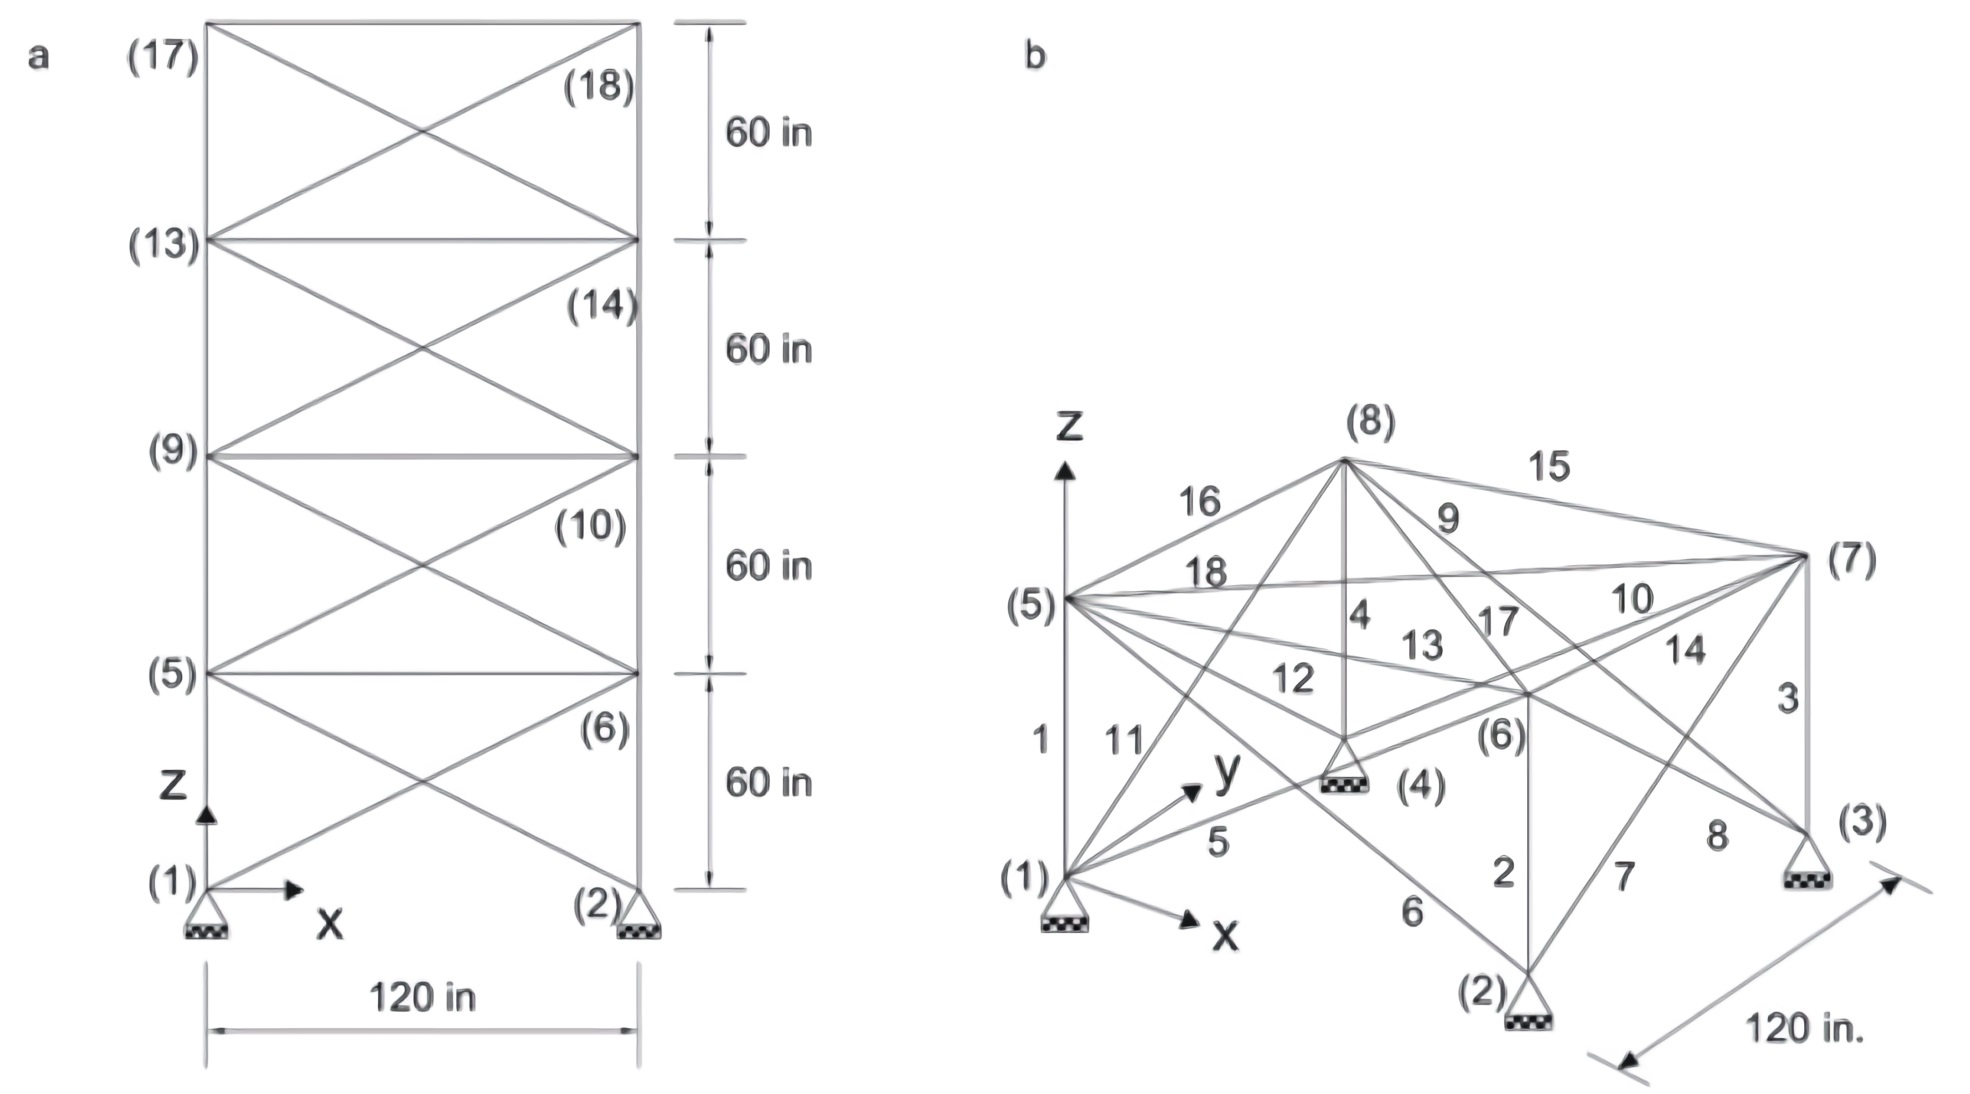
3.2. Example 2: Spatial Trussing of 72 Elements
In Figure 4, the structural configuration for the spatial truss with 72 elements is presented, which are gathered into 16 groups (Table 5). It is established a minimum cross-section area of 0.1 in2 (6.45E-5 m2) that can be increased by 0.001 in2 (6.45E-7 m2), until it reaches 3 in2 (1.935 E-3 m2). The loads are localized in the axis z with a value of - 5 kips (22.24 kN) on the nodes 17, 18, 19 y 20. The material used present maximum allowed stress of 25 ksi (172.37 Mpa) to compression and 25 ksi (172.37 Mpa) to tension. The displacement constrain is set to 0.25 in (6.35E-3 m) in all directions.
4. Results
4.1. Truss Optimization
Table 5-8 reports the results of the application of MCGA and other optimization techniques on the trusses presented in section 3, which were organized with the best result to the left of the table. The criteria to evaluate the performance of the algorithm corresponds to the self-weight of optimized truss and the quantity of structural analysis carried out. The initials N.R. indicate the authors of methodology did not report the corresponding information. The total quantity of structural analysis used on the optimization process (values with a ¨*¨) are determined through a multiplication of the number of iterations by the size of the population. It is important to note that it is not possible to include the number of runs in the comparison, due to others authors reported the number of evaluations based on the best run and not the number from the total of runs. Likewise, diverse authors did not report the quantity of evaluations made to calibrate the genetic parameters.
On Table 5 and 6 the results for different GAs methodologies are shown. The self-weight obtained by the MCGA for example 1 and 3 is just 2.5% and 1% greater than the minimum self-weight found by other authors, respectively. One comparison of quantity of structural analysis made indicates that there is no defined pattern to the behavior of the different methodologies. If the quantity of analysis made for GA from reference 4 and MCGA are compared, it is observed that the MCGA executed 6100 additional analysis for example 2 and 5200 less analysis for example 1. The analysis of results regarding the number of analysis made is not completely just if we consider the following: I) the quantity shown correspond to the best run of each one of the reported algorithms and not to the sum of the analysis carried out in each of the runs of the algorithms; II) the quantity of times that it was necessary to try out combinations of genetic parameters to find the most adequate one is not reported. Actually, the total of structural analysis made should be calculated considering the number of tests necessary to calibrate the genetic parameters, the quantity of runs made, the number of iterations to reach a solution and the size of the population. The MCGA has the advantage that is does not require to calibrate the parameters, and that in general, it uses a lesser quantity of evaluations of the objective function compared to those required for the GAs shown in Table 5 and 6.
Table 5 Results of other methodologies that use GAs for the Truss with 25 elements
| Reference | 3 | 7 | 6 | 4 | 5 | MCGA |
|---|---|---|---|---|---|---|
| Weight in pounds (kg) | 483.35 (220.14) | 484.64 (219.83) | 484.85 (219.92) | 485.90 (220.40) | 493.80 (223.98) | 495.33 (224.68) |
| Populations | 40 | N. R. | 200 | 900 | N. R. | 100 |
| No. of Iterations | N. R. | N. R. | 146 | 400 | N. R. | 148 |
| No. of structural analysis | N. R. | N. R. | 29,200* | 360,000* | 20,000 | 14,800* |
Tables 7 and 8show the performance of different metaheuristics used on GAs to optimize the studied trusses. The MCGA obtained a configuration for example 1 which is 2.3% more heavy than the lightest structure obtained by other metaheuristics, being that diverse techniques produced the same configuration. The later can be due to low quantity of variables optimized. In the case of quantity of evaluations, the MCGA occupied the second place in quantity of analysis made. Regarding the example 2, the self-weight of the truss and the quantity of the required evaluations it in the mean of values obtained by other methodologies. This shows that future research must be done to improve the search ability of the algorithm. Finally, from the reported data, it is inferred that the metaheuristics produced a determined level of success in function of the analyzed truss. For example, The Harmony Search algorithm obtained results in par with other methodologies used with trusses with 25 elements, while with trusses of 72 elements it obtained worst results.
Table 7 Results of other methodologies that use GAs for the Truss with 25 elements
| Reference | 15 | 13 | 16 | 14 | 17 | MCGA proposed |
|---|---|---|---|---|---|---|
| Metaheuristic | Simulated Annealing | Harmony Search | Ant Colony | Big-Bang Big Crunch | Particle Swarm Optimization | Genetic Algorithm |
| Weight in pounds (kg) | 484.33 (219.69) | 484.85 (219.92) | 484.85 (219.92) | 484.85 (219.92) | 484.85 (219.92) | 495.33 (224.68) |
| Populations | 1 | 30 | N. R. | 100 | 50 | 100 |
| No. of Iterations | 39,201 | N. R. | 100 | N. R. | 500 | 148 |
| No. of structural analysis | 39,201 | 18,734 | N. R. | 9,090 | 25,000 | 14,800 |
Table 8 Results of other methodologies that use GAs for the Truss with 72 elements
| Reference | 18 | 19 | 14 | 17 | 13 | MCGA proposed |
|---|---|---|---|---|---|---|
| Metaheuristic | Bee Colony Opt. | Teach. Learn. Based Opt. | Big-Bang Big Crunch | Particle Swarm Opt. | Harmony Search | Genetic Algorithm |
| Weight in pounds (kg) | 363.84 (165.4) | 379.63 (172.19) | 379.85 (172.30) | 388.94 (176.42) | 389.08 (176.48) | 383.87 (174.12) |
| Populations | N. R. | N. R. | N. R. | N. R. | N. R. | 200 |
| No. of Iterations | N. R. | N. R. | N. R. | N. R. | N. R. | 126 |
| No. of structural analysis | N. R. | 19,709 | 19,621 | N. R. | 27,113 | 25,200 |
4.2. Analysis of the configuration of the solutions found
Tables 9 and 10show the best configurations of the cross-sections found for the examples by the metaheuristics presented in section 3.1. The results prove the existence of different cross-section configuration that produce a similar self-weigh for the structure. Reference 15 and 18 reported trusses configuration of 25 elements that present sections different for 3 of the 8 groups of elements with a difference in self-weight of 0.3%. The configuration obtained by the MCGA presents a considerable difference in the cross-section area of group 2 compared with the best solution, reason why the self-weight obtained was not the best. In the truss with 72 elements there is more variation between the solutions, being that 9 groups presents differences in the cross-section area greater than 5% in case of references 19 and 6, with a difference in self-weight of only 0.7%. The proposed algorithm obtained similar values to other analyzed methodologies in the paper. The previous results show a multimodal nature to the problem, reason why it is necessary to introduce a characteristic to the GA to manage this type of characteristics. With this, it is expected a better convergence of the proposed algorithm to the global optimum.
Tabla 9 Cross-section configuration found by diverse authors for truss with 25 elements.
| References | |||||||
|---|---|---|---|---|---|---|---|
| Groups | Elements | 4 | 13 | 11 | 6 | 3 | MCGA |
| 1 | 1 | 0.10 | 0.10 | 0.10 | 0.10 | 0.10 | 0.10 |
| 2 | 2-5 | 0.30 | 0.40 | 0.30 | 0.10 | 1.20 | 1.10 |
| 3 | 6-9 | 3.40 | 3.40 | 3.40 | 3.40 | 3.20 | 3.20 |
| 4 | 10-11 | 0.10 | 0.10 | 0.10 | 0.10 | 0.10 | 0.10 |
| 5 | 12-13 | 2.00 | 2.20 | 2.10 | 1.90 | 1.10 | 0.10 |
| 6 | 14-17 | 1.00 | 1.00 | 1.00 | 1.00 | 0.90 | 1.10 |
| 7 | 18-21 | 0.50 | 0.40 | 0.50 | 0.70 | 0.40 | 0.50 |
| 8 | 22-25 | 3.40 | 3.40 | 3.40 | 3.40 | 3.40 | 3.40 |
| Weight | 483.35 | 484.33 | 484.85 | 485.90 | 493.80 | 495.33 | |
Table 10 Cross-section configuration found by diverse authors for truss with 72 elements
| References | |||||||
|---|---|---|---|---|---|---|---|
| Groups | Elements | 18 | 19 | 14 | 4 | 6 | MCGA |
| 1 | 1-4 | 0.1675 | 0.1562 | 0.1565 | 0.156 | 0.154 | 0.158 |
| 2 | 5-12 | 0.5346 | 0.5493 | 0.5507 | 0.555 | 0.604 | 0.546 |
| 3 | 13-16 | 0.4443 | 0.4097 | 0.3922 | 0.370 | 0.442 | 0.411 |
| 4 | 17-18 | 0.5803 | 0.5698 | 0.5922 | 0.510 | 0.604 | 0.511 |
| 5 | 19-22 | 0.5208 | 0.5317 | 0.5209 | 0.620 | 0.505 | 0.610 |
| 6 | 23-30 | 0.5178 | 0.5159 | 0.5172 | 0.530 | 0.550 | 0.553 |
| 7 | 31-34 | 0.0100 | 0.1000 | 0.1004 | 0.100 | 0.109 | 0.100 |
| 8 | 35-36 | 0.1048 | 0.1000 | 0.1005 | 0.100 | 0.118 | 0.100 |
| 9 | 37-40 | 1.2968 | 1.2617 | 1.2476 | 1.250 | 1.288 | 1.116 |
| 10 | 41-48 | 0.5191 | 0.5111 | 0.5269 | 0.523 | 0.469 | 0.553 |
| 11 | 49-52 | 0.0100 | 0.1000 | 0.1000 | 0.101 | 0.100 | 0.100 |
| 12 | 53-54 | 0.0101 | 0.1000 | 0.1012 | 0.105 | 0.100 | 0.100 |
| 13 | 55-58 | 1.7907 | 1.9064 | 1.8577 | 1.860 | 1.702 | 1.808 |
| 14 | 59-66 | 0.5166 | 0.5061 | 0.5059 | 0.513 | 0.496 | 0.525 |
| 15 | 67-70 | 0.0100 | 0.1000 | 0.1000 | 0.100 | 0.100 | 0.100 |
| 16 | 71-72 | 0.0100 | 0.1000 | 0.1000 | 0.100 | 0.100 | 0.100 |
| Weight | 363.86 | 379.63 | 379.85 | 380.78 | 382.35 | 383.87 | |
4.3. Convergence of the MCGA
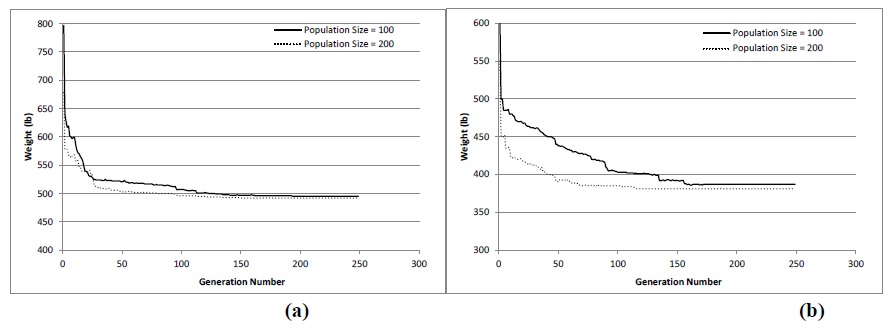
In Figure 5a is shown that by using 200 individuals is possible to obtain a better solution in the first 100 iterations, but with the advance of iterations (around iteration 170) the solution is of the same quality. Results for the truss with 72 elements presents a different behavior (Figure 5b) where the solution found is better. The previous shows that it is important to determine a mathematical equation for the adequate size of the population in function of the truss complexity (number of cross-sections that must be defined and size of the data base for the available profiles). Finally, it can be observed that the improvement of the design reaches 35% approximately compared to the initial value of both examples.
5. Conclusion
In this paper a methodology based on self-adaptive genetic algorithm was presented to minimize the self-weight of steel trusses, which was validated at a functional and computational level, through its application to two trusses reported in literature. The obtained designs for the trusses (configuration of the cross-sections for the elements) show that the algorithm is capable of satisfactorily obtaining economical solutions from a data base of previously defined sections by the user. The obtained results (self-eight and objective function evaluation) are comparable to those obtained in other metaheuristics.
Even though none of the examples obtained the least weight, the proposed methodology presents the advantage that does not requires the definition of the parameters by the user, the above leads to requiring less amount of evaluations of the objective function and that the results have less dependency with the values of the genetic parameters. Likewise, the results show diverse structural configurations for the truss having a similar weight in the search space (multi-modal search space). Thus, for the best performance of the proposed GA there’s techniques that can be used for the management of multimodal functions. From the above, it is expected to increase the possibility that the optimal solution found could be global.

