


 Inglês (pdf)
 Artigo em XML
 Referências do artigo
 Enviar este artigo por email
 Citado por SciELO
  Citado por Google
  Similares em
SciELO
Similares em
SciELO  Similares em Google
 Permalink
1. Introduction
Statistics in the industry help to establish relationships between variables, predictions 1,2, continuous improvement, statistical control, and problem-solving process. Regarding continuous improvement, Jia et al. 3 established a quality control method in the textile industry based on the statistical information generated by images from a camera of the condition of defective and non-defective fabrics. On the other hand, the statistical process control or SPC allows knowing if a process is capable of producing parts without defects. Moica 4 confirmed that the use of SPC in the production of aluminum parts has a significant influence on cost reduction; He recorded the costs derived from internal and external failures to the manufacturing process in 12 months before implementing the SPC, later he recorded the costs and was able to determine the improvement by estimating the cost reduction. For their part, Wang et al. 5 were able to establish a complete control system by presenting a multivariate statistical process control method (MSPC). In this method, the influences of the operations before and after the operation analyzed were included and not as in the case of SPC from a traditional study.
Regarding relationships between variables, Qi Q. et al. 6, proposed an improvement method by eliminating redundant design specifications. They determined the dependence between surface roughness specifications of mechanical parts through a correlational statistical study and eliminated unnecessary specifications. In addition, Mahmoud et al 7 were able to predict the correlation between hardness and mechanical stress of aluminum casting manufactured with different amounts of silicone using a statistic regression modeling approach. Mikó 8, in his work about mechanical measurements, was able to establish an adjusted regression model to predict values of flatness on surfaces of mechanical parts. However, unlike Mahmoud and Mikó, it is necessary to predict the behavior of the dependent variables at the population level. Therefore, the use of inferential statistics is required, which can give relationships between variables and establish significant statistical models as in the case of Heidarian and Palkowski 9 who, through a multiple and significant regression model, were able to determine the relationship between the resulting eccentricity of tubes after a manufacturing process where the controlled variables were the mechanical properties of the material, the geometry and the tool for the manufacture of the tubes.
For this research work, inference statistics allowed to determine the relationship between the parameters recorded in an engine cold testing with the machining characteristics of the cylinder heads in a problem-solving process. The quality control process implemented in the company where the research was developed uses coordinate measuring machines and engines cold testing. The coordinate machines are used to control the machining of the internal components, and the engine cold testing evaluates the general assembly at the end of the production line. The engines are 100% checked, and the tests are automatically done. The engine cold testing uses a servomotor to freely rotate the crankshaft engine. In this process, there is not combustion, the fuel is not used. This is the reason why the test is named engine cold testing 10-13. During the diagnosis, when the servomotor rotates the crankshaft 10,11,13, the following parameters are measured: air pressure, oil pressure, vibrations and noises in the head and cylinder block, components synchronization, and torques 10-12,14. With the values obtained from the measurements, the engine cold testing computer compares with reference limits, and in this way an engine is rejected or accepted. The reference limits were obtained from measurements made to engines without operating problems 11.
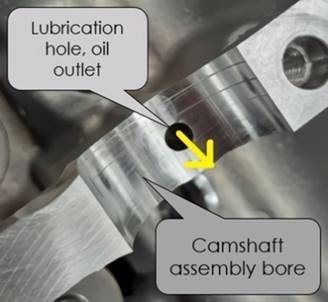
It has been identified that one of the main rejections in the engines cold testing is related to the machining of cylinder heads in the part of the camshaft bores, see Figure 1
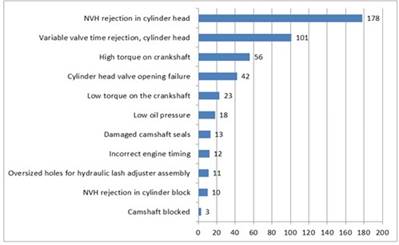
During regular production, when there is a rejection like that, the cylinder head is only changed and it is analyzed in a general way without establishing any precise argument that allows knowing which machining needs to be adjusted. Therefore, it was decided to initiate a formal investigation to determine the relationship between the conditions of the machining and the rejections of the engine cold testing.
2. Methodology
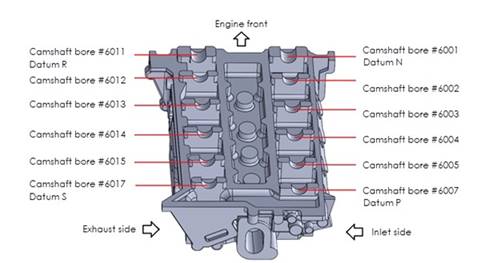
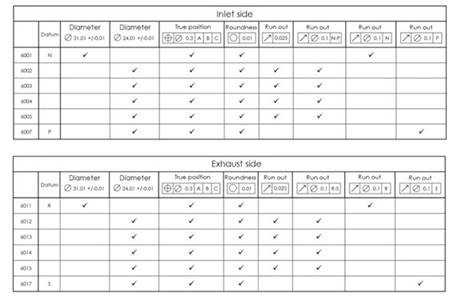
A sample of 124-cylinder heads was taken from the production line, and the heads were dimensioned in a Zeiss Acura coordinate measuring machine (CMM). Subsequently, each head was assembled to an engine to later be diagnosed in a HIRATA engine cold testing, the above was done between the months of July to August 2019 where the production was 81,000 engines (1500 engines per day). The machining characteristics that were measured from each cylinder head were: diameter, the true position, the runout, and the roundness for the 12 bores that assemble the camshafts. Figure 2 shows how the camshaft bores were identified, and Figure 3 shows the design specifications.
It is important to mention that the process is qualified, so that, external influences to the measurement processes were considered 8, additionally, sizing systems such as the coordinate measuring machine have its certificate to guarantee the quality of the measurements. Maul et al. 15 comment that there must be a basis to have confidence in the results of the measurements; R&R studies determine if the measurement instruments are capable of generating reliable data.
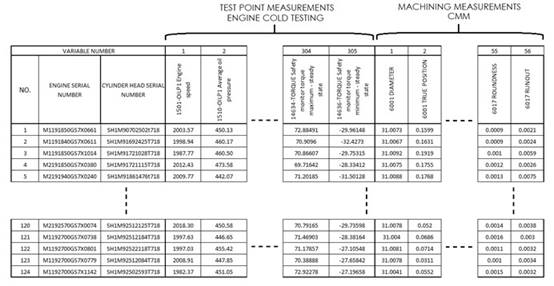
Using CMM, 56 machining characteristics were dimensioned for each head as shown in Figure 3. Hence a data matrix was established with 124 rows corresponding to the sample individuals and 56 columns corresponding to the measurements of the characteristics. On the other hand, the 124 engines were diagnosed by using 305 parameters or test points regarding air pressure, oil pressure, vibrations and noises in the head and cylinder block, timing components, and torques. From the above, a second matrix was also established with 124 rows corresponding to the simple individuals and 305 columns corresponding to the test points. Finally, the data from both matrices were combined into one as is referenced in Figure 4.
To determine relationships between the engine cold testing results and the machining of the cylinder heads, regression equations such as Eq. 1 were proposed to infer relationships at the population level.
where:
Y i = The dependent variable i or test point i, with i = 1, 2,…, 305.
X k = The independent variable or machining characteristic k, with k = 56.
β k = The regression coefficient k, with k = 56.
α = Constant term.
e = Error.
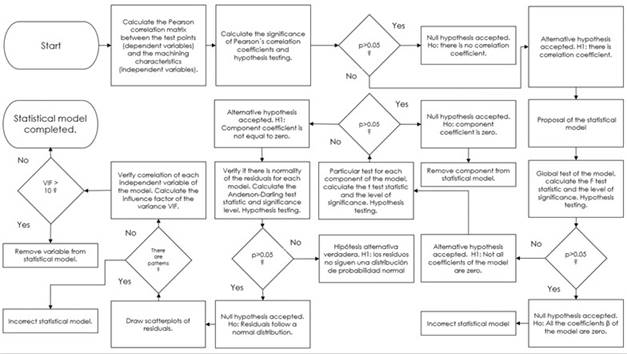
The following steps were followed to obtain the significant statistical models: Step 1.- The statistical program Minitab was used and was adjusted to use the method called steps forward. Step 2.- Global tests of the proposed models were done by using the F test statistic with a significance level of 0.05. Additionally, a null and an alternative hypothesis were tested, where H0: All coefficients β 1 through β 56 are equal to zero, and H1: Not all coefficients β 1 through β56 are equal to zero. Step 3.- Specific tests were done for each component of the proposed models by using the t-test statistic with a significance level of 0.05. The null and alternative hypothesis were tested, where H0: β 1 = 0, β 2 = 0,…,β 56 = 0, and H0: β 1 ≠ 0, β 2 ≠ 0,… , β 56 ≠ 0. Step 4.- An normality test of the residuals was done by using the Anderson-Darling test statistic with a significance level of .05, also scatter diagrams were prepared to verify the absence of patterns or trends. Step 5.- The absence of correlations between the independent variables of the models were verified by using the variance inflation factor VIF, this step avoids instability to the statistical model in addition to the comments of Melhem et al 2.
The above steps are summarized in the flowchart shown in Figure 5
3. Results and discussion
From the 305 test points and using the procedure shown in Figure 5, 77 significant statistical models were determined (25.25%), and 228 were not (74.75%) due to the following reasons: 1.- There was no normality in the residuals (60.66%, 185 Test Points), 2.- there were no significant correlations between the test points and the machining characteristics (13.11%, 40 Test Points) and finally, there were 3 test points that had the same value (.98%).
Due to the extension of the results generated for the 77 test points, it was considered for this paper to present only the information of one of the points most influenced by the machining conditions, this was the test point #1610. It is clarified that the results of the other 76 test points have their statistical models which were tested by inferential statistics.
3.1 Results and discussion of test point #1610.
This test point measures the engine oil pressure and the limits programmed for acceptance in the engine cold testing are from 275 to 330 kPa. The assumption that the engine oil pressure is influenced by the condition of the camshaft bores lies in the fact that there are lubrication holes, as illustrated in Figure 6.
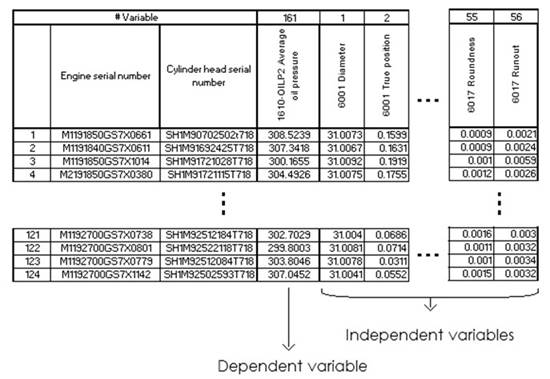
The results of the measurements done by the CMM and the engine cold testing were ordered in a data matrix as illustrated in Figure 7, so that the rows were the 124 individuals in the sample (cylinder heads and engines), and the columns were the 57 variables, one dependent variable (test point #1610) and 56 independent variables (cylinder head characteristics).
The data were analyzed in the Minitab statistical software according to the flow chart proposed in Figure 5, the proposed statistical model was:
In Eq.2the variables of the true position of bore #6001 and the local runout of bore #6005 showed significant correlations regarding the test point #1610 in a step-forward iteration process. In the global test of the model, the F test statistic had a value of 22.34, and it was statistically significant. Hence the alternative hypothesis H1 was true, and the null hypothesis H0 was false. In the F distribution graph (Figure 8a), the value calculated by the software was on the right side of the critical value or in the zone of acceptance of the alternative hypothesis.
Source: own elaboration
Figure 7 Data matrix with the measurements of machining characteristics and TP #1610.
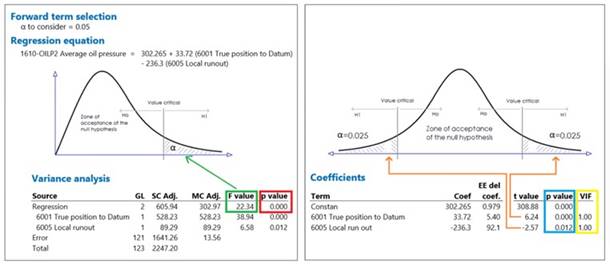
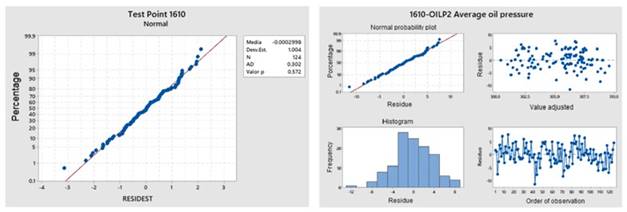
Regarding the specific tests for each component of the model, the t-test statistics had the values of 308.88 for the constant term, 6.24 for the machining of the true position of bore #6001, and -2.57 for the machining of the local runout of bore #6005. The three values were statistically significant so that the alternative hypothesis of the existence of these components was verified as true. Figure 8b shows the t distribution curve where the values calculated are located within the acceptance zone of the alternative hypothesis H1. In the residual normality test, the Aderson-Darling test statistic showed 0.302 with a p-value of 0.572 (Figure 9a). Hence the null hypothesis (Ho: the residual distribution comes from a normal distribution) was verified as true and the alternative hypothesis is false. In addition, in the scatter diagram of the residuals (Figure 9b), no patterns or trends were observed on both sides of the horizontal line of the graph.
If the values at the extremes of Figure 9a (3 sample individuals) were removed from the study, the resulting model would be:
Additionally, 2 distant points appear again at the extremes of the graph. If this process is repeated 3 times, 7 individuals from the sample would be eliminated and the statistical model would be:
Because an additional variable appears in the statistical model in addition to the fact that some individuals in the sample were eliminated, it was decided to leave the model of Eq. 2.
Finally, the independent variables (true position of bore #6001 and the runout of bore #6005) are not correlated because the values of the variance inflation factor in both cases were equal to 1 (Figure 8b, VIF value).
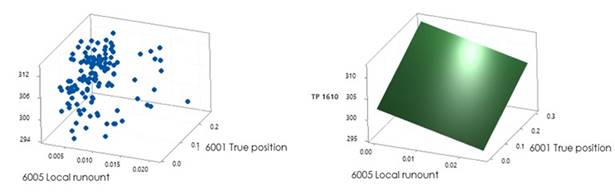
Using Eq. 2 and the R2 adjusted value, the engine oil pressure changes 25.8% due to the interaction of the machining. It can be predicted that when the true position of bore #6001 is increased, the pressure rises. On the other hand, when the runout of bore #6005 is increased, the pressure decreases. The statistical model geometrically represents a plane in three-dimensional space and predicts pressure values at different machining conditions (see Figure 10). A pressure value of 306.5 kPa can be predicted (within the range allowed in the engine cold testing) when the true position and the runout are within the limits of their tolerances, which are 300 microns for the true position and 25 microns for the runout.
3.2 Applications of the statistical model of test point #1610.
The first application of the statistical model is that it allows us to know which machining of the cylinder head affects the engine oil pressure. When there are deviations in the oil pressure, the deviations in the true position and the runout of the mentioned machining must be corrected.
To adjust the true position machining, the tool position must be moved by adjusting the parameters of the machine numerical control in the direction that corrects the deviation, on the other hand, to correct the runout machining, the tool must be adjusted by a procedure that already exists in the company.
To validate the statistical model, the oil pressures measured by the engine cold testing were compared with the pressures predicted by the model in two engines of regular production. In both cases the percentages of error were less than 5 percent, see table 1.
The second application of the model is that it allowed us to know that the test limits for oil pressure must be adjusted. The engine cold testing releases engines even when the true position or the runout are out of their specifications. In the first engine in table 1, the deviation of the true position is at the limit of its specification (.2975 mm), however the pressure measured by the engine cold testing and predicted by the model are 303.85 kPa and 311.11 kPa which are only 1.35 kPa y 8.61 kPa above the nominal value (302.5 kPa).
Table 2 shows 5 predictions of oil pressure calculated by the model. In prediction 1 deviations in the machining are not considered, the pressure calculated is only 0.2 kPa less than the nominal value. In prediction 2, deviations in the machining are at the limit of their specifications however the pressure calculated is within its specification and above its lower limit, this situation should not happen. In predictions 3 to 5, the oil pressures are within specification although the dimensional deviations are out of specification, these situations should not happen either.
Table 1 Statistical model validation
| Engine serial number | Cylinder head serial number | Deviation from the true position of bore # 6001 (mm) | Deviation from the local runout of bore # 6005 (mm) | Engine pressure measured by engine cold testing (kPa) | Engine pressure predicted by statistical model (kPa) | Percentage of error |
|---|---|---|---|---|---|---|
| M1192260GDXX0371 | SH1M92221316T718 | 0.2975 | 0.005 | 303.85 | 311.11 | 2.39 |
| M2191850GS7X0006 | SHNM91780705M718 | 0.2514 | 0.0048 | 307.27 | 309.56 | 0.74 |
Source: own elaboration.
Table 2 Prediction of average oil pressure
| Prediction | Deviation of the true position from the nominal value (mm) | Deviation of the runout from the nominal value (mm) | Prediction of average oil pressure (kpa) | Observation |
|---|---|---|---|---|
| 1 | 0 | 0 | 302,3 | True position and runout without deviation |
| 2 | 0,03 | 0,025 | 297,4 | True position and runout at specification limit, pressure within specification |
| 3 | 0,21 | 0,035 | 301,1 | Runout out of specification and pressure within specification |
| 4 | 0,4 | 0,01 | 313,4 | True position out of specification and pressure within specification |
| 5 | 0,33 | 0,055 | 300,4 | True position and runout out of specification and pressure within specification |
Source: own elaboration
Derived from the above it is necessary to adjust the limits of test point # 1610. This proposal will be presented to the quality and manufacturing departments of the engine plant so that the modifications can be made.
4. Conclusions
Using the procedure shown in Figure 5, it was possible to establish 77 significant statistical models that relate the results from the engine cold testing with the machining conditions. Additionally, the procedure can be used to find relationships between the same results and other combustion engine components such as the crankshaft or the cylinder block. On the other hand, it is important to establish significant statistical models that allow us to know the validity of the model at the population level regardless of the level of accuracy.
It was determined that the engine oil pressure is related to the machining condition of the local runout and the true position. The statistical model indicates that when increasing the true position, the oil pressure increases too, in contrast with the runout, when it increases, the oil pressure decreases. On the other hand, no evidence was found that the roundness and diameter affect the engines oil pressure. Additionally, the use of the statistical model made it possible to know that the engine cold testing releases engines even though the true position and the runout are out of specification. Derived from the above, it is necessary to adjust the limits of test point #1610.
In summary, inferential statistics is a powerful tool that allows us to relate the results of an engine cold testing in the combustion engine assembly process with respect to the machining conditions of its components. In this sense, relate the rejections in the assembly line with the failures in the machining processes and in this way focus the resources to correct and prevent those failures.

