


 Inglés (pdf)
 Articulo en XML
 Referencias del artículo
 Enviar articulo por email
 Citado por SciELO
  Citado por Google
  Similares en
SciELO
Similares en
SciELO  Similares en Google
 Permalink
Introduction
Within the study of fluid dynamics for different operations, especially in the industrial sector, the transport of fluids is a fundamental and well-studied part, due to the pressure losses that can occur along their path 1. Pressure drop is an important parameter because it influences the proper operation, evaluation and design of processes 2. The pressure losses can be calculated with equations derived from Bernoulli's Theorem taking into account the necessary balances for each situation.
In the calculation of pressure drop, in addition to kinetic or potential energy factors, there are friction loss and fitting loss factors. The latter, known as minor losses, refers to those occurring when there is a change in the section or path of the fluid such as curves, bifurcations, elbows, joints, valves, branches, expansions, contractions, among others. The pressure loss can vary according to the geometry of the pipe, placement of arrangement of pumps, valves or fittings, the material of the pipe, the speed of the fluid, among others 3.
There are several expressions to calculate friction losses of theoretical or experimental origin, but in the case of minor losses there is not an absolute expression that shows a unique result; the usual is to find a variety of values reported from different researchers, suppliers or manufacturers of fittings finding different values for the same fitting. In addition, the coefficient of minor losses can be taken as a variation of the friction factor with respect to the length and diameter of the pipe or as a constant for turbulent flows 4.
The evaluation of the loss coefficient is important because it allows to decrease the overall losses of the system and to obtain the best operating conditions. These conditions can be known from experimental tests in a network of pipes with different geometries, accessories and valves with load variations; this is how different studies are highlighted where the above is observed. In China, the flow coefficient was evaluated because it was associated with energy losses, although they used simulation, they used pipe networks with fittings for validation 5. In Quito-Ecuador, a test bench was designed and built for leakage testing of pipes and fittings. 6.
For all the above reasons, the need for studies such as the one presented in this article is highlighted, where the effect of flow variation on the pressure drop in pipes with fittings in the unit FF-DF-270/EL of the University of Cartagena is evaluated, determining the coefficient of minor losses (Kf) caused by elbows, valves, bifurcations, varying the flow in the values of 24, 20, 16, 12 L/min.
Methodology
Description of the experimental equipment
The equipment used for this research is the Universidad de Cartagena's unit FF-DF-270/EL, whose scheme is shown in Figure 1. It consists of a water storage tank, two centrifugal pumps located in parallel, a rotameter, an electronic pressure sensor, voltage and amperage meter, and smooth piping systems with fittings. As the main interest was to work with a pipe with different fittings, the water was only allowed to pass through pipe 4 of 1" nominal diameter, PVC schedule 80, which is composed of a 90° elbow, slanted seat valve, 45° elbow, a Y joint, a ball valve, and a T joint. The properties of the water, such as density and viscosity, were measured using correction factors considering the temperature and atmospheric pressure in Cartagena.
Experimental of Kf calculation
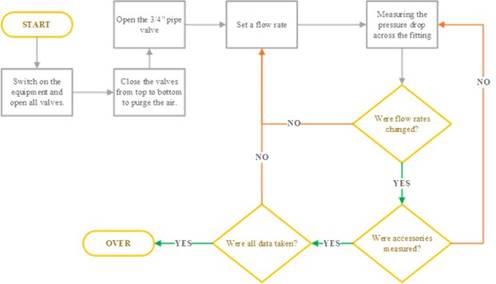
To take the data in the equipment, initially the water level in the tank was checked, the equipment was turned on and the pumps were activated at full power (1750 rpm). All the valves were opened to debug the system guaranteeing the exit of air in the pipes, then all the valves were closed with the exception of the one that gives way to pipe 4. For the pressure drop data, flows of 24, 20, 16, 12 L/min were used and with pressure sensor hoses they were in each fitting as follows: 90° elbow, Inclined seat valve, 45° elbow, direct Y joint, branch path Y joint, ball valve, a direct T joint and a branch path T joint. Finally, the data were recorded, and this procedure was repeated five times. Figure 2 presents the methodology for starting-up the plant. The flow managed during the experimental runs allowed managing generalized Reynolds numbers from 13075 to 26151 considering the specifications of diameters, speeds and the rheological properties of the water.
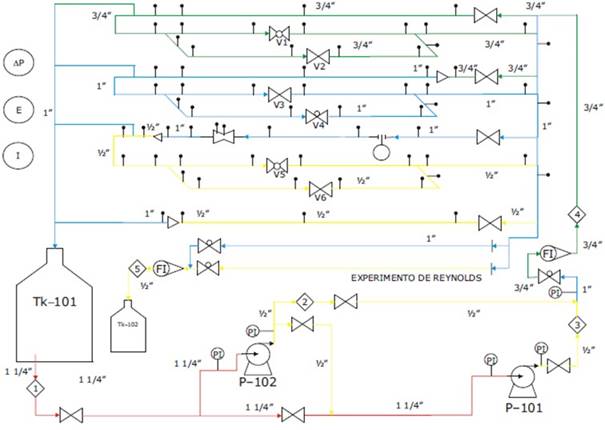
where differential pressure (ΔP), differential of potential (E) and current (I) are the parameters to be measured. Pipes of different internal diameter sizes (1/2'', 3/4'', 1’’ and 1 1/4'') are made of PVC and all are schedule 80. The feed tank (Tk-101) and recuperation tank (Tk-102) are fabricated in High-density polyethylene (HDPE), and have capacities of 100 and 20 L, respectively. Centrifugal pumps (P-101 and P-102) have a variable speed motor, with 0.5 HP, 6<H<21.5 and 3450 rpm. All experiments were made by quintupled.
Pressure losses tests
Pressure losses can be determined through a mechanical energy balance, according to Equation 1, which is a derivation of Bernoulli's Theorem applied to a system of constant area with incompressible fluid, disregarding the terms associated with kinetic and potential energies, without changing the height of the fluid and considering that the velocity was kept constant throughout the section 7.
Where ℎ𝑓 are the losses because of the fittings on the pipe and 𝛾 represents the specific weight equal to 𝜌*𝑔.
The minor losses occur at the transition of the fluid within different fittings elbows, valves, pipe measuring elements, can be expressed as a function of the kinetic height corrected by the empirical coefficient (𝐾𝑓) (8) , which is the coefficient of resistance and is determined by Darcy's equation (Eq. 2) 9.
Where 𝐾𝑓; loss coefficient; 𝑣𝑝𝑟𝑜𝑚, average flow velocity; g, gravity. The average flow velocity is the ratio of volumetric flow and pipe cross-sectional area 10.
The loss coefficient is defined as the dimensionless value of the pressure drop between two pipe sides when there is a fitting 11. The determination of the 𝐾𝑓 coefficient was made from a linear regression of the lower loss data pairs ℎ𝑓 (using equation 1) and the kinetic head data (𝑉2/2𝑔), from the average of the five experimental pressure drop data 12. After that, a linear equation was adjusted obtaining the value of Kf for each fitting 13), (14) . Then, the theoretical pressure drops, and the error were calculated. All experiments were made by quintupled.
Results and discussion
Measurement of experimental pressure drop
Using the unit FF-DF-270/EL of the G block at the University of Cartagena, data was collected of flow rates and experimental pressure drops for each fitting in the selected pipe section. The data is summarized in Table 1 where the experimental pressure drop data (KPa) represents the average of the data reflected in the pressure meter.
Table 1 Average experimental pressure drops [KPa]
| Q (L/min) | T Branch | T Direct | 90° Elbow | V. Seat I | Y Branch | Y Direct | 45° Elbow | V. Ball |
|---|---|---|---|---|---|---|---|---|
| 12 | 0.37 | 0.27 | 0.45 | 0.36 | 0.22 | 0.22 | 0.23 | 0.21 |
| 16 | 0.52 | 0.34 | 0.53 | 0.47 | 0.29 | 0.24 | 0.30 | 0.24 |
| 20 | 0.67 | 0.40 | 0.69 | 0.59 | 0.32 | 0.25 | 0.35 | 0.25 |
| 24 | 0.85 | 0.43 | 0.82 | 0.73 | 0.37 | 0.26 | 0.42 | 0.27 |
In previous studies, high pressure drops have been reported for non-Newtonian fluids and handling flows between 227 and 2271 L/min, which was especially influenced by the rheological properties of the fluids, considering that they had a density higher than that of water 15. In a pilot plant, experiments were carried out for flows between 3.25 and 14 L/min, reporting proportionality between the pressure drop and the increase in volumetric flow; Similarly, they pointed out that the smaller the diameter of the pipe, the greater the loss of pressure due to friction, because there is a greater amount of fluid (water) in contact with the walls of the pipe (boundary layer), where the roughness is very important in determining such losses 16.
From the data obtained in the experience it can be noticed the similar behavior in all the fittings, where, as the flow increases the pressure drop also increases and this is due to the velocity factor related in both equations, being the T branch and the valve seat I the element who contribute the most to the pressure drop in the plant. In addition, the velocity is directly proportional to the flow (equation 3) as proportional to the pressure drop (equation 4):
Where: 𝑄 is flow; 𝑣 is velocity; 𝐴 is area of flow section; 𝑃 is pressure; 𝜌 is density; 𝑔 is gravity.
With the values of Table 1 the minor losses were calculated (ℎ𝑓) isolating from equation 1. From the area of the pipe (0.000464 m2) and flow rate, the kinetic head values are obtained with values of 0.0095, 0.0169, 0.0263, 0.0379 for the flow rates 12, 16, 20, 24 L/min, respectively.
Calculation of the coefficient of minor losses
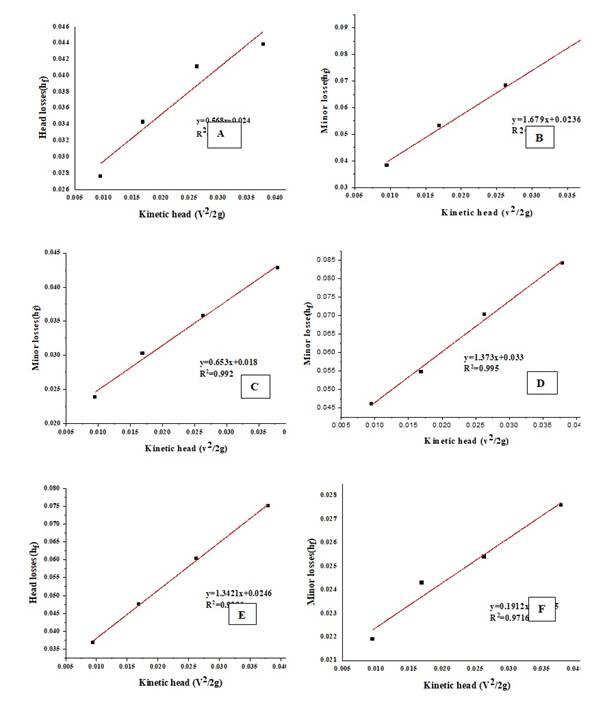
Figure 3 represents the linear regression between the minor losses and the kinetic head for the fittings studied, using Excel in order to find the equation of the line and obtaining the value of the coefficient of minor losses Kf that fits to the data of the tests, where the data in blue points represent the experimental values and the black line represents the fit. These values represent the averages of all the determinations and, moreover, they are not restricted to the type of flow developed in the measurement; that is, they correspond to the entire profile obtained with the volumetric flows handled in the experiments for each one of the accessories.
The Kf values obtained and the R2 values are shown below in Table 2.
Table 2 Adjusted Kf values and R2
| Fittings | Kf obtained | R2 |
|---|---|---|
| Branch path T | 1.676 | 0.996 |
| Direct path T | 0.568 | 0.931 |
| 90° elbow | 1.370 | 0.994 |
| Slanted Seat Valve | 1.342 | 0.999 |
| Branch path Y | 0.491 | 0.958 |
| Direct path Y | 0.135 | 0.942 |
| 45° elbow | 0.652 | 0.992 |
| Ball valve | 0.191 | 0.971 |
The results obtained in the present study for the Kf (Table 2) present a variation with respect to the literature of approximately 10.5%. These differences are attributed to the so-called mutual influence or resistance interference effect mentioned by Rabinovich for hydraulic systems. Said interference effect basically considers that the presence of nearby accessories causes alterations in the flow lines and consequently the friction factor increases. In addition, it must not be forgotten that most of the studies have been carried out using accessories placed respecting a free distance between them, and/or the losses are attributed to a single accessory. However, in most material flow situations in the industry, the proximity of accessories is a reality; then, the interference effect should not be ignored. According to Rabinovich, the flow current regime is altered since the fluid approach conditions to each of the accessories are altered 15.
Calculation of the theoretical pressure drop
The adjusted Kf data were used in equation 2 for the calculation of the theoretical minor losses, theoretical hf, then with equation 1 the theoretical pressure drop values for the four flows are obtained. Finally, the percentage error used in equation 5 is calculated.
Table 3 summarizes the pressure drop and error data for each fitting, where it is possible to identify that the errors between the pressure drop measurement and the data calculated from the setting are close together. The range of error percentage values is between 0% and 8%, the lowest value being 0.04% for the branch path T-joint fitting and the highest being 8.16% corresponding to the direct path T-joint fitting. In addition, the error average is 2.58% indicating the error percentage frequency below values of less than 2.41%.
Through Table 3 it is possible to corroborate the theory about the proportionality of the flow with the pressure drop, where the higher the flow the higher the pressure drop 8, This can be seen throughout the table regardless of the fitting and whether the data is experimental or theoretical, observing the same upward behavior as the flow rate rises.
Table 3 Experimental pressure drop, theoretical and percentage of error
| Fitting | Pressure drop (KPa) | Flow (L/min) | |||
|---|---|---|---|---|---|
| 12 | 16 | 20 | 24 | ||
| Branch path T | Exp | 0.37 | 0.52 | 0.67 | 0.85 |
| Theoretical | 0.380 | 0.501 | 0.656 | 0.845 | |
| % error | 1.54% | 4.09% | 2.03% | 0.04% | |
| Direct path T | Exp | 0.27 | 0.34 | 0.40 | 0.43 |
| Theoretical | 0.277 | 0.318 | 0.371 | 0.435 | |
| % error | 2.62% | 5.29% | 8.16% | 1.61% | |
| 90° elbow | Exp | 0.45 | 0.53 | 0.69 | 0.82 |
| Theoretical | 0.439 | 0.538 | 0.665 | 0.820 | |
| % error | 2.41% | 0.76% | 3.47% | 0.25% | |
| 45° elbow | Exp | 0.23 | 0.30 | 0.35 | 0.42 |
| Theoretical | 0.236 | 0.283 | 0.344 | 0.417 | |
| % error | 1.35% | 4.54% | 1.89% | 0.17% | |
| Slanted Seat Valve | Exp | 0.36 | 0.47 | 0.59 | 0.73 |
| Theoretical | 0.359 | 0.455 | 0.580 | 0.731 | |
| % error | 0.37% | 2.12% | 1.63% | 0.35% | |
| Ball valve | Exp | 0.21 | 0.24 | 0.25 | 0.27 |
| Theoretical | 0.213 | 0.225 | 0.241 | 0.261 | |
| % error | 0.45% | 5.49% | 2.85% | 3.34% | |
| Branch path Y | Exp | 0.22 | 0.29 | 0.32 | 0.37 |
| Theoretical | 0.231 | 0.266 | 0.312 | 0.367 | |
| % error | 3.05% | 7.35% | 3.89% | 0.39% | |
| Direct path Y | Exp | 0.22 | 0.24 | 0.25 | 0.26 |
| Theoretical | 0.218 | 0.227 | 0.240 | 0.255 | |
| % error | 1.09% | 4.69% | 3.82% | 1.52% | |
Also in Table 3 it is possible to identify the pressure drop of each fitting, indicating that the fittings with the highest pressure drop are the branch path T-joints (0.85KPa in flow 24 and 0.37KPa in flow 12) and 90° elbow (0.82KPa in flow 24 and 0.45KPa in flow 12), this is due to the location of both fittings in the equipment where the water flow makes an abrupt movement of 90° compared to the direction of fluid entrance to the system, being subdued to an angular acceleration 17, and are the fittings with the highest loss ratios 1.67 and 1.37, respectively.
The Ball Valve, branch path Y-joint and direct path fittings have the lowest pressure drops with values for 24 L/min flow rate of 0.27, 0.37, 0.26 KPa respectively and for 12 L/min flow rate of 0.21, 0.22, 0.22 KPa, correspondingly. These fittings have the lowest K-coefficient values, 0.19 for the ball valve, 0.13 for the branch path Y-joint and 0.49 for the Y-direct path.
Comparison of the calculated Kf’s with those in the plant manual
The values of the coefficient of minor losses Kf obtained in this study were compared with the data referenced in the work manual of the equipment used. Table 4 reflects the Kf values of the manual reported and the percentage of error with those of the study. For the fittings Slanted Seat Valve, Y direct path and Branch path there is no data reported. The highest error obtained is 95.71% for the 90° elbow fitting due to the high coefficient obtained from the adjustment and the lowest error value is for the branch path T-joint fitting 1.41% due to the closeness in the reported values.
Table 4 Kf value comparison with manual
| Fittings | Kf obtained | Manual | |
|---|---|---|---|
| Kf reported | % error | ||
| Branch path T | 1.676 | 1.7 | 1.41% |
| Direct path T | 0.568 | 0.5 | 13.60% |
| 90° elbow | 1.370 | 0.7 | 95.71% |
| Slanted Seat Valve | 1.342 | ---- | ---- |
| Branch path Y | 0.491 | ---- | ---- |
| Direct path Y | 0.135 | ---- | ---- |
| 45° elbow | 0.652 | 0.4 | 63.00% |
| Ball valve | 0.191 | 0.18 | 6.11% |
Comparison of Kf with other references
The comparison of the loss coefficients Kf obtained with other authors who report Kf values for the fittings branch path T-joint, T direct path, 90° elbow and 45° elbow was carried out. Table 5 reflects the reported values and the percentages obtained from the comparison of the coefficients. The highest percentage of error was found to be 98.6% for the 90° elbow, which is the highest percentage of error in the entire comparison. The low percentage is 21.4% for the branch path T-joint because the value obtained is higher than the one reported by the author 9.
With regard to the Rotorpump company 18, of Argentina, the maximum error is 63% for the 45° elbow and the minimum value is 3.7% for the branch path T. And in the case of the Costa Rican legal information system 19, the 45° elbow is the fitting with the highest percentage of error with 91.8% and the 90° elbow the lowest with 4.6%, as reflected in Table 5.
Table 5 Comparison of Kf with other authors
| Fittings | Kf obtained | Mott | Rotorpump | Scij | |||
|---|---|---|---|---|---|---|---|
| K reported | % error | K reported | % error | K reported | % error | ||
| Branch path T | 1.676 | 1.38 | 21.4% | 1.74 | 3.7% | 2.23 | 24.8% |
| Direct path T | 0.568 | 0.46 | 23.5% | 0.52 | 9.2% | 0.91 | 37.6% |
| 90° elbow | 1.370 | 0.69 | 98.6% | 0.92 | 48.9% | 1.44 | 4.9% |
| 45° elbow | 0.652 | 0.37 | 77.2% | 0.40 | 63.0% | 0.34 | 91.8% |
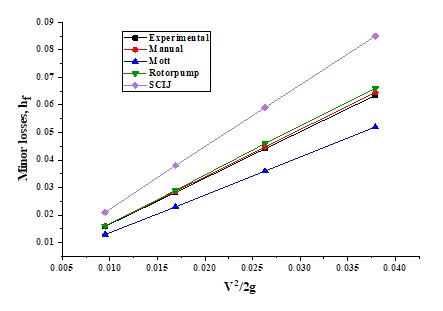
The comparisons made can also be reflected in the Figures shown below, which illustrate the ratio of minor losses to the kinetic head for fittings with coefficient reports. Figure 3 shows the graph of the behavior of the minor losses and the kinetic head for the T-branch path fitting with respect to other authors. The values of minor losses obtained with the Kf coefficient are between the values reported in the Manual and Rotorpump; they are above Mott's result values and below SCIJ.
For the case of the direct path T-joint, Figure 4 represents the graph of the behavior of the minor losses with respect to other authors. The line of data obtained is close to the lines of the Manual and Rotorpump. The Mott line is below and the SCIJ above all the lines obtained, reflecting that the percentage of error is higher for the reported coefficient.
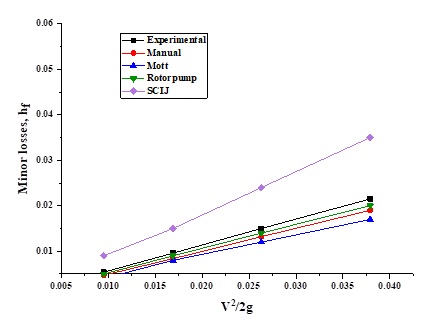
Figure 5 represents the graph for the Elbow 90° fitting with respect to other authors. The values obtained and those reported SGIJ are close to and above the other data. The Manual and Mott data are close and farther away from others showing the closeness of the data and represent the biggest errors. The Rotorpump data are located at a midpoint.
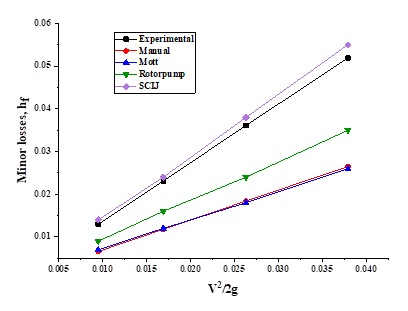
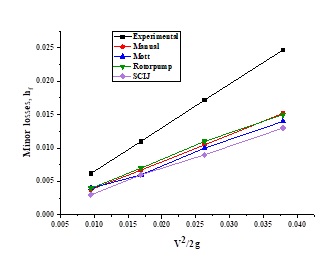
Figure 6 represents the graph of the 45° Elbow fitting. The data lines from other studies are below the line obtained in this study showing. that the data of the loss coefficient Kf has a high value with respect to the other comparisons. Figure 7.
Conclusions
The pressure drop in the FF-DF-270/EL unit of the G block at the University of Cartagena is directly proportional to the feeding flow supplied, in the same way the loss coefficient depends on each fitting in the pumping system, allowing the calculation of the theoretical pressure drop and comparing it with the real pressure drop obtaining average error percentages of 2.58%. When comparing the coefficients obtained in this investigation with the design values, an average error percentage of 35.98% can be appreciated, observing a closeness of the data. Contrasting the values obtained with those reported in the literature, differences can be seen with RototPump of 31.2% and with Mott of 52.5%.

