


Services on Demand
Journal
Article
 English (pdf)
 Article in xml format
 Article references
 Send this article by e-mail
Indicators
-
 Cited by SciELO
 -
 Access statistics
Related links
-
 Cited by Google
 -
 Similars in
SciELO
Similars in
SciELO -
 Similars in Google
Share

 Permalink
TecnoLógicas
Print version ISSN 0123-7799On-line version ISSN 2256-5337
TecnoL. vol.20 no.40 Medellín Dec. 2017
Artículo de investigación/Research article
Feature extraction based on time-singularity multifractal spectrum distribution in intracardiac atrial fibrillation signals
Distribución tiempo singularidad del espectro multifractal para el análisis de electrogramas intracardiaco en fibrilación atrial
Robert D. Urda-Benitez1, Andrés E. Castro-Ospina2, y Andrés Orozco-Duque3
1 Biomedical engineering, Grupo de Investigación e Innovación Biomédica, Instituto Tecnológico Metropolitano, Medellín-Colombia, roberturda@itm.edu.co
2 MSc in Industrial Automation, Electronic Engineer, Grupo de Automatización, Electrónica y Ciencias Computacionales, Instituto Tecnológico Metropolitano, Medellín-Colombia, andrescastro@itm.edu.co
3 Ph.D. in Medical Sciences, Electronic Engineer, Grupo de Investigación e Innovación Biomédica, Instituto Tecnológico Metropolitano, Medellín-Colombia, andresorozco@itm.edu.co
Fecha de recepción: 19 de junio de 2017/ Fecha de aceptación: 28 de agosto de 2017
Como citar / How to cite
R.D. Urda-Benitez, A.E. Castro-Ospina, y A.F. Orozco-Duque, Feature extraction based on time-singularity multifractal spectrum distribution in intracardiac atrial fibrillation signals. TecnoLógicas, vol. 20, no. 40, pp. 97-111, 2017.
Abstract
Non-linear analysis of electrograms (EGM) has been proposed as a tool to detect critical conduction sites (e.g., rotors vortex, multiple wavefronts) in atrial fibrillation (AF). Likewise, studies have shown that multifractal analysis is useful to detect critical activity in EGM signals. However, the multifractal spectrum does not consider the temporal information. There is a new mathematical formalism to overcome this limitation: the time-singularity multifractal spectrum distribution (TS-MFSD), which involves the time variation of the spectrum. In this manuscript, we describe the methodology to compute the TS-MFSD from EGM signals. Moreover, we propose a methodology to extract features from time-singularity spectrum and from singularity energy spectrum (SES). We tested the features in an EGM database labeled by experts as: non-fragmented, discrete fragmented potentials, disorganized activity, and continuous activity. We tested the area under the receiver operating characteristic (ROC) curve. The proposed features achieve an area under the ROC curve of 95.17% when detecting signals with continuous activity. These results outperform those reported using multifractal analysis. To our knowledge, this is the first work that report the use of TS-MFSD in biomedical signals and our findings suggest that time-singularity has the potential to be used in the study of non-stationary behavior of EGM signals in AF.
Keywords: Cardiac signals, Detrended Fluctuation Analysis, multifractal singularity spectrum, non-linear signal processing, time series analysis.
Resumen
El análisis de la dinámica no lineal de señales de Electrogramas Intracardiacos (EGM) ha sido propuesto como una herramienta para detectar sitios críticos de conducción eléctrica (ejm: rotores o múltiples frentes de onda) en fibrilación auricular (AF). Estudios previos han mostrado que el análisis multifractal puede ser de utilidad para detectar actividad crítica en la señal EGM. A pesar de esto, el análisis multifractal no considera la información temporal de la señal. Existe un nuevo formalismo matemático para superar esta limitación, el cual es llamado Distribución Tiempo-Singularidad del Espectro Multifractal (TS-MFSD), que involucra la variación en el tiempo del espectro. Este artículo describe una nueva metodología para calcular características a partir del TS-MFSD en señales EGM. Nosotros evaluamos los métodos descritos en una base de datos de EGM etiquetada por expertos en cuatro clases: no fragmentada, potenciales fragmentados discretos, actividad desorganizada y actividad continua. Para evaluar el rendimiento se calculó el área bajo la curva ROC. El mejor resultado de las características propuestas alcanzó un área bajo la curva ROC de 95.17% en la detección de señales con actividad continua. Este resultado supera los reportados mediante la utilización del análisis multifractal. Hasta donde sabemos, este es el primer trabajo que reporta la utilización de la TS-MFSD en señales biomédicas, y nuestros resultados sugieren que el análisis Tiempo-Singularidad tiene el potencial para estudiar el comportamiento no estacionario de las señales EGM en AF.
Palabras clave: Análisis de series de tiempo, análisis no lineal de señales, Espectro de Singularidad Multifractal, señales cardiacas.
1. Introduction
Atrial Fibrillation (AF) is one of the most common arrhythmias, with a prevalence of approximately 3% in adults and it is associated with heart failure and stroke[1]. Besides pharmacological treatment to control AF, catheter ablation of AF is the recommended treatment to cure AF. This procedure uses a radiofrequency catheter to burn sites in the endocardium to block the action potential propagation. Pulmonary vein isolation (PVI) is one of the most useful types of ablation. PVI is used to isolate the ectopic foci that are located in pulmonary veins and initialize AF. PVI presents a success rate of around 80% in patients with paroxysmal AF. Nevertheless, in patients with persistent AF, the correct rate is less than 40% [2]. Authors have developed other ablation strategies to improve the success rate of AF ablation. Since PVI is only guided by anatomical information, ablation guided by the analysis of electrogram (EGM) signals has been proposed to detect critical conduction sites on the atria. Critical sites are related with arrhythmogenic substrates or mechanisms that generate or sustain the arrhythmia -e.g., ectopic foci, multiple wavefronts or rotors’ vortices. EGM are signals acquired using intra-cardiac catheters in contact with the endocardium. Several studies have shown that sites related with sustaining mechanisms of AF present EGM signals with continuous activity or local activity with multiple deflections (fragmented EGMs) [3], [4]. Therefore, several authors have proposed mathematical tools to study EGM complexity. Studies have shown that EGMs exhibit a non-linear behavior. Therefore, the computation of entropy measures and fractal analysis has been useful to detect fragmented EGMs [5]-[7].
Evidence obtained in a previous work shows that fragmented EGM signals can be detected by using multifractal analysis (MF), which outperform fractal and entropy features [8]. Multifractal analysis is an extension of the fractal concept. Fractal signals present self-similarities and statistic properties of scale invariance, which can be described by a single quantity -e.g., Hausdorff dimension or Hurst exponent. If the fractal properties are not homogenous and change with time, the signal must be described by different local Hurst exponents [9]. Accordingly, multifractal analysis is a more suitable method for studying EGM signals.
The multifractal spectrum shows the distribution of singularity exponents. However, this spectrum does not display the temporal information. This condition makes it difficult to describe the non-stationary behavior of biomedical signals. There is a new mathematical formalism to overcome such limitation: time-singularity multifractal spectrum distribution (TS-MFSD), which involves the time variation of the MF spectrum [10]. The difference between MF and TS-MFSD could be compared to the difference between frequency and time-frequency transforms. TS-MFSD has been reported as a mathematic tool and it has been tested in synthetic signals; however, its application in biomedical signals has not been tested.
This paper describes the methodology to compute the TS-MFSD from EGM signals and the development of new methods to extract features from the time-singularity spectrum. We tested the features in an EGM database labeled with four classes, including continuous activity. The aim of this work is to test TS-MFSD on EGM signals and compare the performance of TS-MFSD with respect to MF analysis. Features computed from TS-MFSD could improve the performance of the detection of signals with continuous activity. Then, these features could be used as a tool to detect critical conduction sites in AF and assist ablation procedures guided by EGM.
2. Materials and methods
2.1 EGM Database
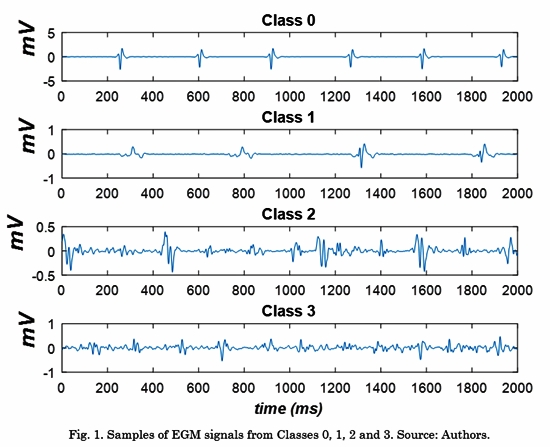
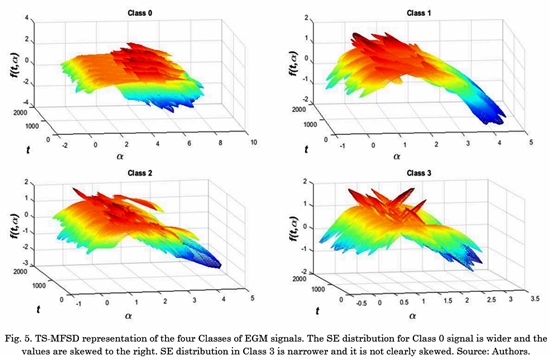
A database of 429 EGM signals acquired from 11 AF patients was used in this work. This database was collected in the Staedtisches Klinikum Karlsruhe in Germany and it was made available to our group by the Karlsruhe Institute of Technology [11]. In this database, signals were recorded using the NavX system (St. Jude Medical, St. Paul, USA) and a multipolar circular catheter during AF ablation procedures. The sample frequency was 1200 Hz and the signals were filtered with a band-pass filter between 30 Hz and 250 Hz. Each EGM was independently annotated by two electrophysiologists and divided into four classes. Class 0: EGM with non-fragmented potentials and organized activity. Class 1: EGM with fragmented potentials separated by a non-activity baseline. Class 2: EGM with fragmented potentials and disorganized activity. Class 3: EGM with continuous electrical activity.
In this work, the aim of the analysis is to detect signals belonging to Class 3.
The 429 EGM signals were distributed as follows: 153 signals in Class 0, 75 signals in Class 1, 148 signals in Class 2, and 53 signals in Class 3. A signal of each Class is shown in Fig. 1 For a complete description of the database, see the manuscript by Schilling et al. [12].
2.2 TS-MFSD Power Law Representation
Fractals describe irregularities of time-series whose properties of self-similarity are evidenced with statistical similarity at different scales. For fractal dimension estimation, the covering of the set is considered by means of balls of diameter ε> 0, where N(ε) represents the number of balls needed to cover the whole set. Thus, an approximation of the irregular longitudinal measurement is defined as L(ε)=ε N(ε), where N(ε) satisfies the power law N(ε)~ε-D as ε → 0. Constant D represents the fractal dimension or Hausdorff dimension [13].
Fractal dimension has shown to contain relevant information about the signals that present a nonlinear dynamic, but a single fractal dimension cannot completely characterize a signal with a single descriptor. Therefore, it becomes necessary to incorporate multifractal analysis, a term used for systems characterized by a range of different fractal dimensions with which a function f(a) noted as multifractal spectrum (MFS) or spectrum of singularities is associated. In this sense, the power law becomes N(a)~ ε-f(a) , where, α is the singularity exponent (SE) or Hölder exponent [14].
The multifractal spectrum measures the global distribution of singularities with different regularities. However, it has no information on the time-varying singularities exponents, which makes it complex to analyze the dynamics involved in non-stationary and non-linear processes [10].
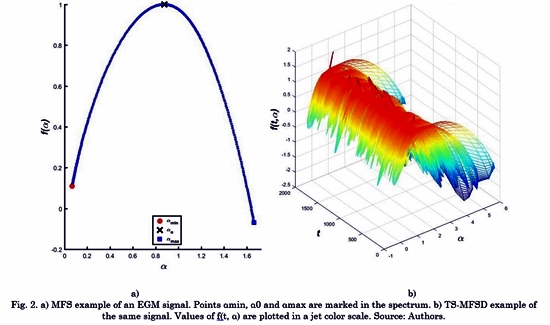
Xiong, in 2012, introduces the mathematical formalism of the TS-MFSD. It is given by the function, which represents a convex function and indicates the characteristic spectral points of the signal evolution. After the analysis of the theory of measurement and Hausdorff dimension, the power law is Nt(a)~ ε-f(t,a) [10].
Fig. 2 shows a comparison between MFS f(a) and TS-MFS f(t,a). The representation of the fractal dimension D corresponds to a single point in the MFS space. MFS is composed of several points, which highlights the minimum singularity exponent amin, the maximum singularity exponent amax and the singularity exponent a0 that correspond to the maximal f(a) . By contrast, TS-MFSD is composed of the time distribution of MFS.
2.3 TS-MFSD based on Detrended Fluctuation Analysis (DFA-MFSD)
MFS estimation can be computed by several methods; the well-known Detrended Fluctuation Analysis (DFA) proposed by Kantelhardten in 2002 [15] is one of the most commonly used in practical applications. DFA consists of five basic steps:
1. Determine the time series “profile”, Y by subtracting the mean value and integrate the time series.This step converts the signal to a random walk like time series.
2. Divide the profile into non-overlapping Ns segments of an equal length of scale s
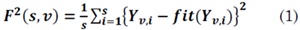
3. Determine the local fluctuation F2(s,v) for each segment, v = 1,...,Ns. F2(s,v) is computed based on the variance of the series profile Y by subtraction the fitting polynomial fit (Yv ) in the segment v , as in [16]:
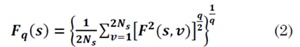
4. Estimate the average of the segments for different scales s and the q-order statistical moments (q ∈ R - {0}) for obtaining the fluctuation function, defined as:
5. Determine the correlation of the power law Fq (S)~ Sh(q) using the log-log graph of F² (s,v) and s for each q, where the exponent h(q) is called generalized Hurst exponent. By analogy with the multifractal formalism, Kantelhardt relates h(q) with the exponent of scale t(q), as t(q) = qh(q) - 1, where t(q) is defined by the partition function Zq(s):
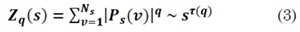
With Ps(v) as a probability box [15].
The singularity spectrum f(a) is obtained via the Legendre transform, as follows:

In the estimation of TS-MFSD by DFA, Xiong et al defined the instantaneous cyclic autocorrelation function of a discrete time-series x (k) as [17]:
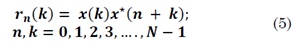
Where k denotes the delayed sample and n the time series samples. Estimation of instantaneous cyclic autocorrelation is the new first step in DFA. The series profile for each n value is computed by subtracting the mean of ⟨ rn ⟩to rn(k) as follows:
Finally, the steps 2 to 5 of DFA are followed for each instant of time ; for more detailed information see [17].
2.4 Singularity Energy Spectrum estimation
If the TS-MFSD contains additional information to the MFS, the Singularity Energy Spectrum (SES) could describe it. By analogy with traditional energy, the energy of a TS-MFSD is the sum of the square modules of f(t,a) on the time axis [17]. SES was proposed in 2012 for practical applications in engineering.
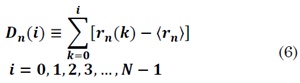
Given the analysis presented by the authors in [17] and based on the fractal energy measurement theory, the estimation of the multifractal spectrum distribution energy of the signal can be seen as:

Where xam represents a signal that corresponds to a discrete fractal sub-band defined as:

To obtain am, the SE, a(n) ∈ [amin , amax ], is divided into such a uniform partition that satisfy the Eq. (8) for a(m) ≤ a(n) ≤ a(m+1).

As depicted in Fig. 3, the amin and amax are extracted from the SE. Each amin represents the interval Ai (δ), where δ = (ai-ai+1)/2.
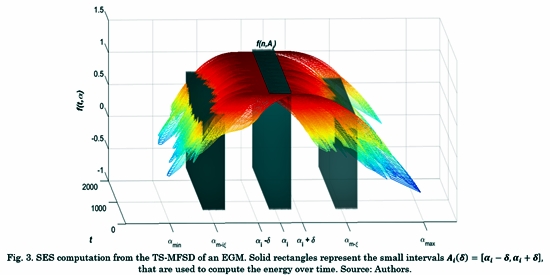
The square module of f (n, Ai ) is taken for all am (n) ∈ Ai at each time sample n.
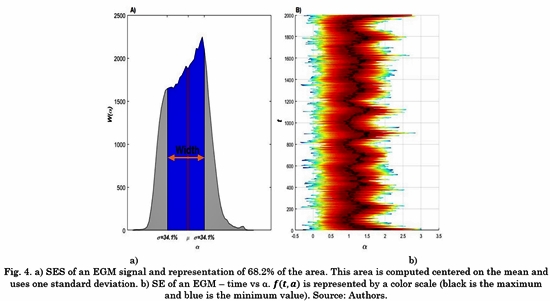
Fig. 4. A) shows an example of the W (am ). Using W (am ), we propose to evaluate the energy contained in the 68.2% of the total area centered on the mean (µ). This value was selected based on one standard deviation. Although this is true only for the normal distribution, in this work we use it as a practical rule of thumb [18]. The difference between SES for EGMs belonging to different classes can be captured by these features. The variability of the SE over time is evidenced in Fig. 4 B), where the black continuous line represents the maximum of the function f(t, a)over time.
2.5 Receiver Operating Characteristic
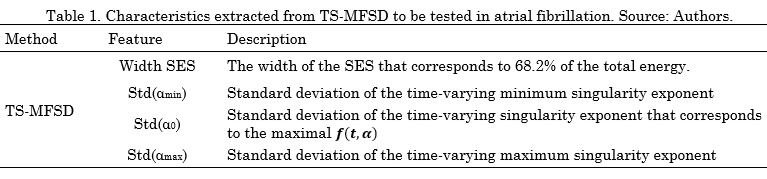
We used the Receiver Operating Characteristic (ROC) curves to evaluate the performance of each characteristic in Table 1 and detect continuous activity in EGM. For each feature, a threshold to discriminate two classes is selected. The performance of the classification can be determined by the confusion matrix shown in Table 2 [19]. We computed the  and the
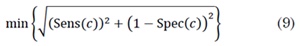
  for a set of values of c. The ROC curve is given by ROC(·) = {( 1 - Spec(c), Sens(c))}. The best cut-off point is defined as in [20].
3. Results and discussion
Experimental results of the TS-MFSD on EGM signals showed a representative change when is computed in signals from different AF classes. Fig. 5 shows the time-singularity spectrum for some samples of EGM signals. We can see difference between spectrum width and changes in SE distribution in time.
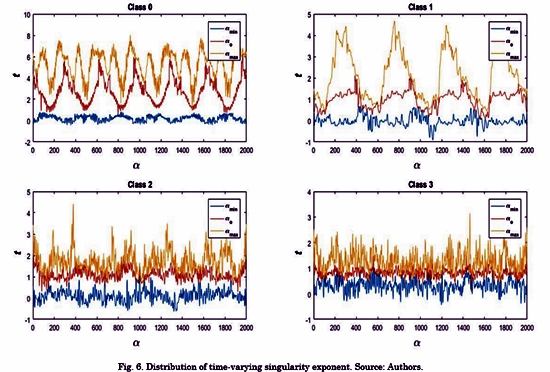
Given the dynamic behavior in time of the SE, the visual analysis can be more representative if we focus on the following three lines: the minimum singularity exponent amin(t); the maximum singularity exponent amax(t); and the singularity exponent a0(t). The latter corresponds to the maximal f(t, a) . Fig. 6 illustrates theses lines for the EGM signals shown in Fig. 5. We can see that these lines for the class 3 signal shows a lower variance in the SE, particularly in a0(t). This line is analogous to the maximum of the spectrum in multifractal analysis [21]. However, in multifractal spectrum, the maximum is a scalar value, and it cannot capture the changes in time of this feature. By contrast, In TS-MFSD, a0(t) is a vector. Accordingly, we used the standard deviation as features to describe the deviation in time of a0(t). The same analysis is made for amin(t), amax(t).
On the other hand, we computed the SES for a more complete analysis of the information contained in the time-singularity spectrum. Fig. 7 shows the SES of samples of EGM signals in each Class.
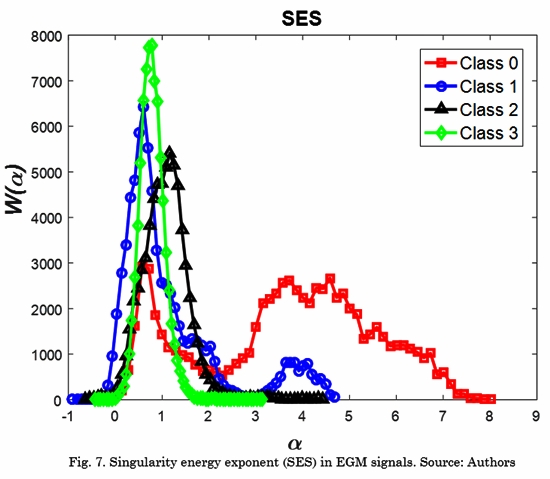
We can see the characteristics described in the spectrum, where class 0 and class 1 are wider and skewed to the right. Class 3 is narrower. This behavior is captured by the proposed feature W(am).
At last, we computed four features: the 68.2% of the area from W(a) which con-tains information about the SES; and the standard deviation of a0(t), amin(t) and amax(t), which contains information about the SES; and the standard deviation of and, which represents the changes of the SE over time.
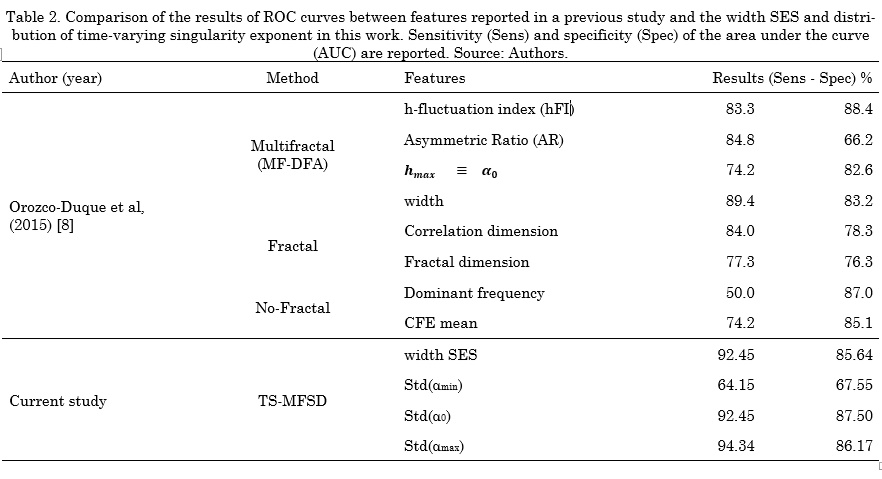
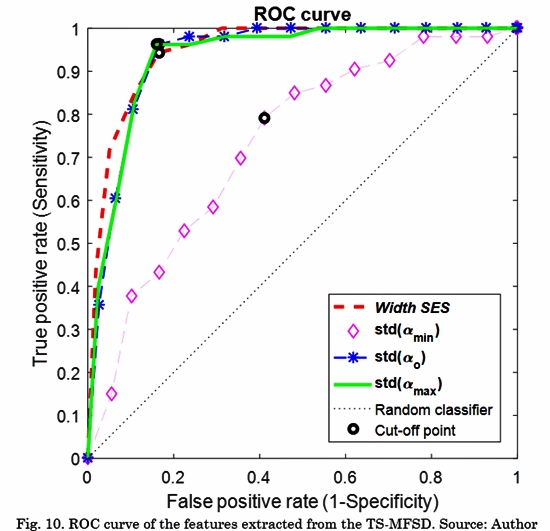
Fig. 8 and Fig. 9 shows the violin plot distribution for each feature. We can see the ability of all the features to distinguish Classes. Only standard deviation of amin(t) does not contain representative information for this task. Taking into account that some authors have suggested that only a high level of fractionation is related with critical sites (e.g., rotor’s vortex) [22], [23], we calculated the Receiver Operating Characteristic (ROC) curves only for distinguishing between Class 3 and the rest. Tabla 3 shows the comparison between our results and a previous study that reported conventional and multifractal features computed in the same database [8]. The proposed features in this study outperform those results regarding the discrimination of Class 3 (signals with continuous electrical activity).
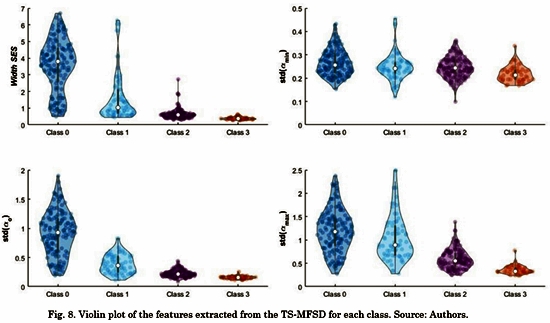
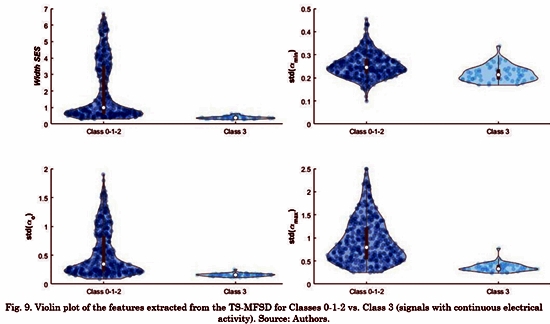

Fig. 10 shows the ROC curves for the proposed characteristic. The thresholds for each cut-off point are 0.544, 0.238, 0.197, and 0.493 for Width SES, Std (αmin), Std (α0), Std (αmax), respectively.
TS-MFSD was proposed by Xiong et al. [10] to overcome the limitation of capturing temporal information of multifractal analysis. TS-MFSD has been tested in synthetic signals and in one application using sea clutter data from an ocean radar. To the best of our knowledge, this manuscript is the first work that reports an application of TS-MFSD in biomedical signals processing.
Instantaneous cyclic autocorrelation function (ICAF) is the most representative step in the computation of TS-MFSD. The process of ICAF calculation generates several temporal series with a high computational cost. Although TS-MFSD includes temporal information of the multifractal spectrum and it could be a useful approach to study biomedical signals, the computational cost limits its application in real time. However, TS-MFSD can become an important tool for offline medical applications where non-linear systems are involved.
EGM signals during AF exhibit non-homogeneous local scaling properties that change over time. In a previous work, a multifractal analysis was performed using the same database of EGM signals [8]. Those results showed that multifractal features outperformed fractal features to discriminate between four Classes of fractionation. Particularly, the detection of the Class with continuous activity achieved a sensitivity of 83.3% and a specificity of 88.4%. Since EGMs are non-stationary and non-homogeneous signals, in our work we hypothesized that the time-singularity spectrum is a better descriptor of the dynamic involved in the system. Our results showed that, in the particular case of detecting EGMs with continuous activity, TS-MFDS presents better performance (92.4% sensitivity and 87.5% specificity) than multifractal features.
Some studies only distinguish between non-fragmented and fragmented EGM signals in AF [3]. However, fragmented signals include different morphologies associated with different conduction patterns [24]. Therefore, the classification of different levels of fractionation has been proposed [11], [25]. Likewise, some studies have shown that catheter ablation of sites that display continuous activity is associated with termination of chronic AF [11], [22], [25]. Therefore, a highly-accurate detection of continuous activity (Class 3) could help to guide ablation procedures. Our findings suggest that the features extracted from TS-MFDS are reliable for discriminating continuous activity in EGM and improving the performance of previously reported features.
The degree of fractionation of EGM signals is, in reality, assumed to be naturally continuous. Nevertheless, a discrete set of levels of fractionation is used in this study due to the impossibility of having experts classify the signals on a smoother scale. In this regard, our findings show that Class 2 and Class 3 are difficult to differentiate. Despite this, the proposed features presented higher sensitivity than specificity. Therefore, the probability of Type II errors is lower than that of Type I errors. According to Hunter el al [23], both Classes are associated with critical sites for AF (e.g., focal drivers and rotors). Even so, the efficacy achieved when ablating areas with continuous electrical activity (Class 3) may suggest greater proximity to the rotor vortex. Therefore, if our features are used to guide ablation procedures, Type I errors imply that Class 2 signals could be classified as continuous activity and a broader region would be ablated. On the other hand, Type II errors imply that signals with continuous activity are not classified as Class 3, which may result in the target area not being ablated. Thus, higher sensitivity is expected in this application.
Future work will be focused on feature selection and classification among the four Classes described in the databases. Moreover, some parameters required to compute the proposed features could be optimized. TS-MFDS features could be used in combination with others as the input for a classifier. Classifying different levels of fractionation could help to locate different conduction patterns on the atrial surface.
4. ConclusionOur findings suggest that TS-MFSD implementation using MF-DFA is a useful tool to study the underlying non-linear dynamics of biomedical signals -e.g., EGM during AF. Likewise, the features extracted from the time-singularity spectrum and the singularity energy spectrum exhibit better performance to detect EGM with continuous activity than multifractal features. This property can be used to locate critical conduction sites in AF. As future work, new features from TS-MFSD must be explored and their discrimination ability tested in a recognition task and the electrophysiological meaning of the TS-MFSD and SES in AF.
References
[1] P. Kirchhof, S. Benussi, D. Kotecha, A. Ahlsson, D. Atar, B. Casadei, M. Castella, H.-C. Diener, H. Heidbuchel, J. Hendriks, G. Hindricks, A. S. Manolis, J. Oldgren, B. A. Popescu, U. Schotten, B. Van Putte, P. Vardas, S. Agewall, J. Camm, G. Baron Esquivias, W. Budts, S. Carerj, F. Casselman, A. Coca, R. De Caterina, S. Deftereos, D. Dobrev, J. M. Ferro, G. Filippatos, D. Fitzsimons, B. Gorenek, M. Guenoun, S. H. Hohnloser, P. Kolh, G. Y. H. Lip, A. Manolis, J. McMurray, P. Ponikowski, R. Rosenhek, F. Ruschitzka, I. Savelieva, S. Sharma, P. Suwalski, J. L. Tamargo, C. J. Taylor, I. C. Van Gelder, A. A. Voors, S. Windecker, J. L. Zamorano, and K. Zeppenfeld, “2016 ESC Guidelines for the management of atrial fibrillation developed in collaboration with EACTS,” Eur. Heart J., vol. 37, no. 38, pp. 2893-2962, Oct. 2016. [ Links ]
[2] K. Yoshida and K. Aonuma, “Catheter ablation of atrial fibrillation: Past, present, and future directions,” J. Arrhythmia, vol. 28, no. 2, pp. 83-90, Apr. 2012. [ Links ]
[3] J. Chen, Y. Lin, L. Chen, J. Yu, Z. Du, S. Li, Z. Yang, C. Zeng, X. Lai, Q. Lu, B. Tian, J. Zhou, J. Xu, A. Zhang, and Z. Li, “A decade of complex fractionated electrograms catheter-based ablation for atrial fibrillation: Literature analysis, meta-analysis and systematic review,” IJC Hear. Vessel., vol. 4, no. 1, pp. 63-72, Sep. 2014. [ Links ]
[4] K. Nademanee, E. Lockwood, N. Oketani, and B. Gidney, “Catheter ablation of atrial fibrillation guided by complex fractionated atrial electrogram mapping of atrial fibrillation substrate,” J. Cardiol., vol. 55, no. 1, pp. 1-12, Jan. 2010. [ Links ]
[5] J. P. Ugarte, A. Orozco-Duque, C. Tobón, V. Kremen, D. Novak, J. Saiz, T. Oesterlein, C. Schmitt, A. Luik, and J. Bustamante, “Dynamic Approximate Entropy Electroanatomic Maps Detect Rotors in a Simulated Atrial Fibrillation Model,” PLoS One, vol. 9, no. 12, Dec. 2014. [ Links ]
[6] D. Novak, V. Kremen, D. Cuesta, K. Schmidt, V. Chudacek, and L. Lhotska, “Discrimination of endocardial electrogram disorganization using a signal regularity analysis,” in 2009 Annual International Conference of the IEEE Engineering in Medicine and Biology Society, 2009, pp. 1812-1815. [ Links ]
[7] A. N. Ganesan, P. Kuklik, D. H. Lau, A. G. Brooks, M. Baumert, W. W. Lim, S. Thanigaimani, S. Nayyar, R. Mahajan, J. M. Kalman, K. C. Roberts-Thomson, and P. Sanders, “Bipolar Electrogram Shannon Entropy at Sites of Rotational Activation: Implications for Ablation of Atrial Fibrillation,” Circ. Arrhythmia Electrophysiol., vol. 6, no. 1, pp. 48-57, Feb. 2013. [ Links ]
[8] A. Orozco-Duque, D. Novak, V. Kremen, and J. Bustamante, “Multifractal analysis for grading complex fractionated electrograms in atrial fibrillation,” Physiol. Meas., vol. 36, no. 11, pp. 2269-2284, Nov. 2015. [ Links ]
[9] P. C. Ivanov, L. A. N. Amaral, A. L. Goldberger, S. Havlin, M. G. Rosenblum, Z. R. Struzik, and H. E. Stanley, “Multifractality in Human Heartbeat Dynamics,” Nature, vol. 399, no. 6735, pp. 461-465, Jun. 1999. [ Links ]
[10] G. Xiong, S. Zhang, and Q. Liu, “The time-singularity multifractal spectrum distribution,” Phys. A Stat. Mech. its Appl., vol. 391, no. 20, pp. 4727-4739, Oct. 2012. [ Links ]
[11] C. Schilling, M. Keller, D. Scherr, T. Oesterlein, M. Haïssaguerre, C. Schmitt, O. Dössel, and A. Luik, “Fuzzy decision tree to classify complex fractionated atrial electrograms,” Biomed. Eng. / Biomed. Tech., vol. 60, no. 3, pp. 245-255, Jan. 2015. [ Links ]
[12] C. Schilling, Analysis of Atrial Electrograms. KIT Scientific Publishing, 2012. [ Links ]
[13] J. Feder, Fractals. Boston, MA: Springer US, 1988. [ Links ]
[14] J. de Souza and S. Pires Rostirolla, “A fast MATLAB program to estimate the multifractal spectrum of multidimensional data: Application to fractures,” Comput. Geosci., vol. 37, no. 2, pp. 241-249, Feb. 2011. [ Links ]
[15] J. W. Kantelhardt, S. A. Zschiegner, E. Koscielny-Bunde, S. Havlin, A. Bunde, and H. E. Stanley, “Multifractal detrended fluctuation analysis of nonstationary time series,” Phys. A Stat. Mech. its Appl., vol. 316, no. 1-4, pp. 87-114, Dec. 2002. [ Links ]
[16] E. A. F. Ihlen, “Introduction to Multifractal Detrended Fluctuation Analysis in Matlab,” Front. Physiol., vol. 3, 2012. [ Links ]
[17] G. Xiong, W. Yu, and S. Zhang, “Time-singularity multifractal spectrum distribution based on detrended fluctuation analysis,” Phys. A Stat. Mech. its Appl., vol. 437, pp. 351-366, Nov. 2015. [ Links ]
[18] R. O. Duda, P. E. Hart, and D. G. Stork, Pattern classification. Wiley, New York, 2001. [ Links ]
[19] T. Fawcett, “An introduction to ROC analysis,” Pattern Recognit. Lett., vol. 27, no. 8, pp. 861-874, Jun. 2006. [ Links ]
[20] G. Cardillo, “ROC curve: compute a Receiver Operating Characteristics curve,” Natick (MA): Math-Works. 2008. [ Links ]
[21] L. Telesca, V. Lapenna, and M. Macchiato, “Mono- and multi-fractal investigation of scaling properties in temporal patterns of seismic sequences,” Chaos, Solitons & Fractals, vol. 19, no. 1, pp. 1-15, Jan. 2004. [ Links ]
[22] Y. Takahashi, M. D. ONeill, M. Hocini, R. Dubois, S. Matsuo, S. Knecht, S. Mahapatra, K.-T. Lim, P. Jais, A. Jonsson, F. Sacher, P. Sanders, T. Rostock, P. Bordachar, J. Clémenty, G. J. Klein, and M. Haissaguerre, “Characterization of Electrograms Associated With Termination of Chronic Atrial Fibrillation by Catheter Ablation,” J. Am. Coll. Cardiol., vol. 51, no. 10, pp. 1003-1010, Mar. 2008. [ Links ]
[23] R. J. Hunter, I. Diab, M. Tayebjee, L. Richmond, S. Sporton, M. J. Earley, and R. J. Schilling, “Characterization of Fractionated Atrial Electrograms Critical for Maintenance of Atrial Fibrillation: A Randomized, Controlled Trial of Ablation Strategies (The CFAE AF Trial),” Circ. Arrhythmia Electrophysiol., vol. 4, no. 5, pp. 622-629, Oct. 2011. [ Links ]
[24] D. H. Lau, S. Zeemering, B. Maesen, P. Kuklik, and others, “Catheter ablation targeting complex fractionated atrial electrogram in atrial fibrillation,” J. Atr. Fibrillation, vol. 6, no. 3, 2013. [ Links ]
[25] R. J. Hunter, I. Diab, G. Thomas, E. Duncan, D. Abrams, M. Dhinoja, S. Sporton, M. J. Earley, and R. J. Schilling, “Validation of a classification system to grade fractionation in atrial fibrillation and correlation with automated detection systems,” Europace, vol. 11, no. 12, pp. 1587-1596, Dec. 2009 [ Links ]

