


 English (pdf)
 Article in xml format
 Article references
 Send this article by e-mail
 Cited by SciELO
  Cited by Google
  Similars in
SciELO
Similars in
SciELO  Similars in Google
 Permalink
1. INTRODUCTION
Oil palm production is one of the most important agroindustrial sectors in several countries in South-East Asia and Central and South America, and its crops cover large areas. According to the Statistical Information System of the Palmero Sector (SISPA), Colombia leads the production of oil palm, with 537,177 hectares in 2018, the second biggest crop in Colombia after coffee [1]. Bud Rot Disease (BRD) in oil palms is one of the most common diseases in Central and South American countries [2]. Specifically, BRD outbreaks have significantly affected the Colombian production, according to the Colombian Federation of Cultivators of Oil Palm, (Fedepalma, Federación Colombiana de Cultivadores de Palma Aceitera). In Tumaco (Nariño), 30 thousand hectares were devastated, while in Puerto Wilches (Santander) and Cantagallo (Sur de Bolivar), BRD destroyed 37 thousand hectares [3].
Hyperspectral Remote Sensing (RS) is an imaging technique that has the potential to identify several materials of interest, such as diseased crops. This technology also provides quantitative information on the spatial vegetation cover, species composition, and physicochemical state of different vegetations and crops [4]. That is possible because different materials within a scene uniquely reflect, absorb, and emit electromagnetic radiation depending on their molecular composition and texture [5]. Hyperspectral RS has been increasingly used to address agricultural problems [6] because the agricultural practices of planting require large areas (hundreds of hectares). Given that oil palm is a perennial tree crop, typically planted in large areas, hyperspectral RS techniques have gained relevance to deal with said agronomic management issue. For instance, the diagnosis and control of diseases in oil palm crops are time-consuming and complex when it is necessary to perform visual inspections of symptoms [7] [8] [9] [10].
Considering factors such as the large dimensions and size of hyperspectral data, several algorithms are required to analyze the data contained in a hyperspectral image (HSI). Several processing tasks have been developed for HSIs, such as classification, target detection, change detection, and unmixing [5]. Classification algorithms are frequently used to map scenes; thus, hyperspectral classification is considered a labeling problem since each pixel must be labeled in accordance with its spectral signature. The main challenge of hyperspectral classification is the low spatial resolution of HSI, which results in the strong presence of mixed pixels. Spectral unmixing takes on great importance to overcome this challenge. Spectral unmixing assumes that pixels are mixtures of few materials called endmembers. Unmixing consists in the estimation of pure spectral signatures and the abundances at each pixel [11]. The linear mixing model (LMM) is a simple but effective model extensively used for spectral unmixing. However, spectral variability still hinders LMM’s ability to offer a high performance [12], [13]. Compared to more complex environments (for example, urban) agricultural scenes can be considered relatively simple, with a limited number of defined land cover classes (for example, crop, soil, weed, and shadow) and a limited variability in the number and type of these classes per pixel. The current study presents an alternative approach to address spectral variability. Variations in the shape and scale of pure spectral signatures are known as spectral variability, an issue that has been identified as a source of error in the analysis and processing of HSIs [14].
In the last decade, several algorithms have been proposed in the literature to describe and address spectral variability [12], [13]. Some authors model the variability through multiple scalars that modulate the endmember matrix. For instance, in [15], variability can be represented by multiple variations of the same endmembers; this information can be used to estimate the parameters that represent the statistical distribution of a specific endmember class. In [16], the authors modify the spectral signature in an additive way, modelling the variability as a value that adds to the endmember matrix, using a perturbed linear mixing model (PLMM). However, a common drawback of the methods mentioned above is the larger number of parameters that must be adjusted. Moreover, the larger the number of land cover materials of interest, the higher the variations of the endmembers, which indicates that the multiple representation approach entails high computational costs. In this work, a computational framework based on weighted linear spectral mixing is adopted with a single tuning parameter: optimization.
This paper presents a tool for oil palm mapping based on spectral unmixing and spectral variability analysis, which allows the identification of different oil palm behaviors based on spectral information that facilitates the management and monitoring of large oil palm plantations. Spectral variability allows the estimation of a better abundance fraction derived from traditional LMM. This study presents a weighted LMM approach that normalizes a spectral signature with positive effects on abundance fraction estimates.
2. METHODS
Linear spectral unmixing is a commonly adopted method to detect subpixel proportions of vegetation, soil, and other materials in hyperspectral RS data. In this section, the proposed computational procedure is described and summarized in Algorithm 1.
2.1 Notation and Preliminaries
In this work, vectors are represented with bold lowercase letters and the matrices, with bold uppercase characters. The expression  means the space of real matrices of size 𝑁𝑟 𝖷 𝑁𝑐. In the vector column
  , the element placed in the 𝑛𝑟 th position is denoted by
  . In the matrices, the element placed in the 𝑛𝑟 th row and 𝑛𝑐 th column is denoted by.
  Additionally, the vector located in the 𝑛𝑟 th row of matrix 𝑿 is denoted by
  and, in the same way, for the 𝑛𝑐 th column, be, represent by
  . Let
. Let 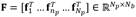 the hyperspectral matrix, where 𝑁𝑝 is the number of pixels; N
b
, the number of bands; and
the hyperspectral matrix, where 𝑁𝑝 is the number of pixels; N
b
, the number of bands; and  , the 𝑛𝑝 -th spectral vector. Due to the fact that the adjacent bands of spectral images are highly correlated, the columns of 𝐅 lie in a subspace with dimension 𝑁𝑠, such that 𝑁𝑠 ≪ 𝑁𝑏 [17]. Then, using the matrix form, the spectral image 𝐅 can be written as the combination of a low-rank parametrization and additive noise see (1)
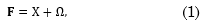
where  is the true signal of numerical rank 𝑁𝑠 and
  is the additive noise matrix that is assumed to be distributed as the matrix normal distribution as (2)
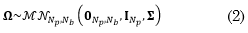
with noise covariance  . Traditionally, the noise in HSIs is modelled as additive Gaussian and i.i.d. with covariance
  [18].
[18].
2.2 Denoising
Recently, noise has been assumed to be non-i.i.d., having a diagonal noise covariance matrix as  [17] [19]. In order to reconvert the non-i.i.d. model into an i.i.d. one, Equation (1) is rewritten as (3).

Therefore, noise matrix is assumed to be i.i.d. in accordance with the matrix normal distribution with noise covariance
  . Specifically, if
  represents the so-called Frobenius norm of the matrix 𝐗, then, the solution to the constrained optimization problem by (4).
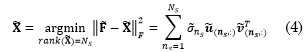
Where  is the truncated SVD of
  When
When  is estimated from, the true signal is
  . Since there is a correlation between bands, the spectral correlation can be removed successfully using multiple linear regression by estimating the diagonal matrix 𝚺 [17].
2.3 Endmember Estimation
In accordance with the LMM described in [20], it is assumed that the spectral scene, for a given pixel, is generated by a linear combination of a small number of deterministic spectral signatures known as endmembers. The basic vectors may be interpretable as the mixing matrix, containing the spectral signatures of the endmembers, and  as the abundance vector of the spectral vector
 From (1), the matrix form of LMM is given by (5).

Where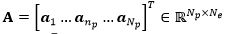 is the matrix of abundances and
  is the matrix of endmembers. Due to physical considerations, the abundance coefficients should satisfy the non-negativity constraints (ANC). When the hyperspectral dataset is denoised, the proposed method only requires the initialization of the endmember matrix 𝚬. The pure pixel-based algorithms assume the presence, in the data, of at least one pure pixel per endmember [11]. The Vertex Component Analysis (VCA) is a pure pixel-based algorithm that iteratively projects data onto a direction orthogonal to the subspace spanned by the endmembers already determined [21]. However, the pure pixel assumption is a strong requirement that may not hold in many datasets. For that purpose, the Simplex Identification via Split Augmented Lagrangian (SISAL) method [22] is a state-of-the-art method that does not require the presence of pure pixels in the image.
2.4 Abundance Estimation
The unmixing procedure can be formulated as a constrained norm optimization problem, in which the observations are affected by Gaussian noise [23]. Furthermore, the abundance sum-to-one constraint (ASC) is defined as
 ; then, the optimization problem is formulated as (6). This problem is solved using the SUnSAL TV algorithm [24]
. Such formulation looks for the sparsest non-negative solution 𝚨 which explains data 𝚾, given endmembers 𝚬. However, traditional LMM approaches fail to fully account for the spectral variability associated with spatial changes. In this work, the LMM has been extended into an augmented linear mixing model by introducing a weighting vector introducing the weigh
; then, the optimization problem is formulated as (6). This problem is solved using the SUnSAL TV algorithm [24]
. Such formulation looks for the sparsest non-negative solution 𝚨 which explains data 𝚾, given endmembers 𝚬. However, traditional LMM approaches fail to fully account for the spectral variability associated with spatial changes. In this work, the LMM has been extended into an augmented linear mixing model by introducing a weighting vector introducing the weigh into (6), the bands that contribute the least to erroneous fraction estimates are prioritized, and the effect of unfavorable bands can be mitigated.
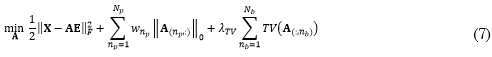
Figure 1 provides an overview of the weighting operation. Note that, when the signatures are normalized by the weight factor, they are very similar. The plot shows that the influence of spectral variability weight on original signatures is more beneficial for the unmixing problem. For that reason, the weighting factor is introduced in (6) to reduce erroneous abundances. The estimation becomes (7).
Source: Authors’ own work.
Fig. 1 Example of weighting operations. Signatures without scaling step (Left) and scaled signatures (Right).
Despite the fact that this regularizer is not convex, the corresponding function also has a simple closed form: the so-called hard-threshold function, where hard (·, a) denotes the component-wise application of the function  . In this work, the SUNSAL TV algorithm was modified [24]. In (2), the soft operator is changed by a weighted hard thresholding operator. Additionally, the TV regularizer term is introduced to impose spatial consistency in hyperspectral sparse unmixing solutions.
Where  is a vector extension of the non-isotropic TV and
  are regularization parameters.
Where  is the number of non-zero entries in
  and
and  is the weighted regularization parameter,
 commonly called the
 “norm” (although it is not a norm).
The proposal is summarized in Algorithm 1.
Algorithm 1: Hyperspectral Unmixing
// Input parameters //
1: Input: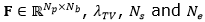 ,
,
// Denoising procedure//
// (Section 2.2) //
2:𝚺→noise_estimation(F) // Alg. 1 [17] //
3:
4: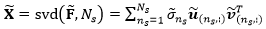
5: 
// Endmember extraction //
// (Section 2.3) //
6:  // Algorithm 1[22] //
// Abundance estimation //
// (Section 2.4) //
7: 
8: 
9:𝚨→ modified_sunsal_tv
// Algorithm 2 [24] //
// Output parameters //
10: Output: 
3. RESULTS AND DISCUSSION
This section presents numerical results from real datasets of oil palm crops in Colombia. Matlab software was used and all the numerical experiments were conducted on a computer with an Intel(R) Core(TM) i7-4790 CPU@3.60GHz and 32 GB of RAM running the operating system Windows 10.
3.1 Data Description
This paper uses a dataset of an oil palm plantation acquired through hyperspectral airborne remote sensing in Colombia. The dataset was recorded and supplied by the Colombian company Quimbaya Aerial Services. These images were acquired in the visible and near infrared (VNIR) range using a HySpex VNIR-1600 hyperspectral camera (Norsk Elektro Optikk AS, Norway) over oil palm crops in the southeastern region of Colombia in 2017.
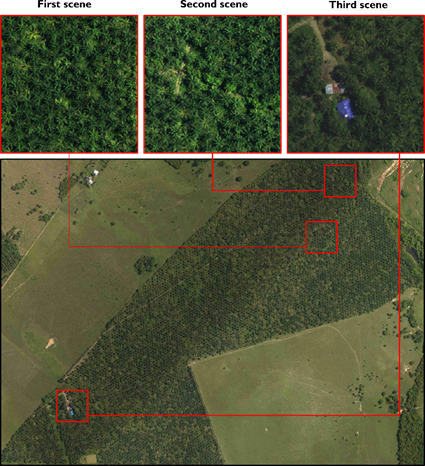
Figure 2 shows the RGB map of the study area, which is located in the Department of Caquetá, Colombia. The study area is a 130-hectare oil palm plantation and the HSIs were acquired through nine flights lines at an altitude of 430 m. Specifically, the dataset considered in this work has a spatial resolution of 0.6 x 0.6 m, and a spectral resolution of 3.7 nm in the spectral range of 415 - 990 nm. The dimensions of the hypercube are spectral bands. Fig. 2 shows three subsections in the scene, and each subsection includes various land cover types, e.g., oil palm plantation areas, other vegetation, bare land, buildings, and roads, etc. The first scene exhibits three materials (Oil Palm, Oil Palm Disease, and Grass); the second scene, four materials (Soil, Tree, Palm, and Grass); and the third scene, five materials (Roof, Soil, Grass, and Palm).
3.2 Experiments and Parameter Analysis
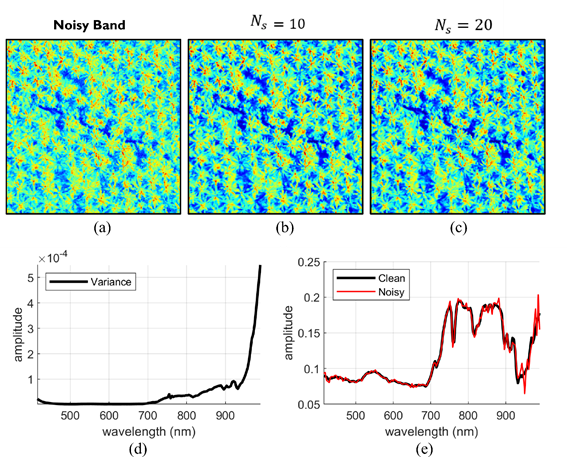
This section explores the effect of selecting the parameter 𝜆𝑇𝑉 and the number of features 𝑁𝑠 on the performance of the proposed method for oil palm identification. In the inference experiments, such as unmixing, classification, and detection, the estimators have been improved when denoising techniques are applied as a preprocessing step. Fig. 3(a) is the original noisy spectral band 160, while Figs. 3(b) and 3(c) show the clean spectral band 160 when the rank of the matrix 𝚾 is 𝑁𝑠 = 10 and 𝑁𝑠 = 20, respectively. As can be seen in Fig. 3(d) (diagonal covariance matrix), the high noise is present in the 160 band, which can be observed in Fig. 3(e) that the pixel in the clean dataset is smooth with respect to the original pixel in the noisy dataset. The estimation of the number of endmembers is a critical stage in the unmixing. In this work, we consider two of the most widely used approaches: virtual dimensionality (VD) [25], which allows some flexibility in the estimation by having an additional input parameter that enables the control of the sensitivity of the method, and hyperspectral signal identification with minimum error (HySime)[17], which offers advanced features when modeling the noise present in the HSIs. The average number of endmembers estimated by the HySime algorithm for the three scenes was 9 endmembers. However, based on knowledge of the actual terrain and each scene used in this work, the endmembers with the greatest abundance and interest in this study are shown (diseased oil palm, healthy oil palm, grass, soil, and roof).
Source: Authors’ own work.
Fig. 3 Original noisy 160-th band (a), clean band when 𝑁𝑠 = 10 (b), clean band when 𝑁𝑠 = 20 (b), estimated diagonal covariance matrix (d), clean and noisy pixel in position (128,128) (e).
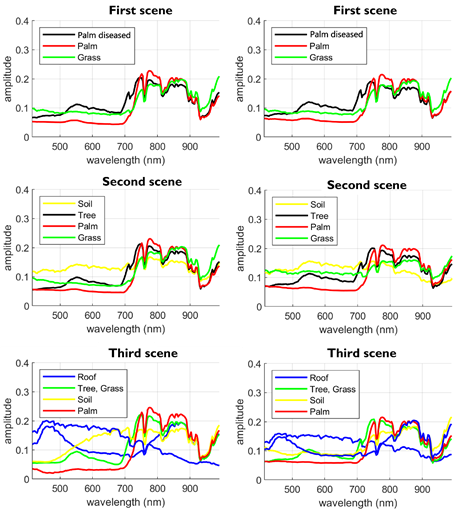
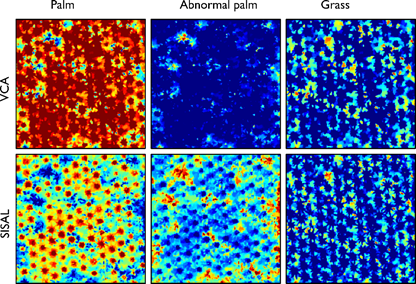
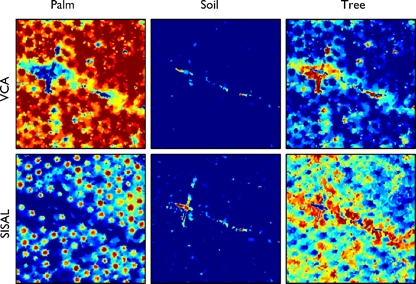
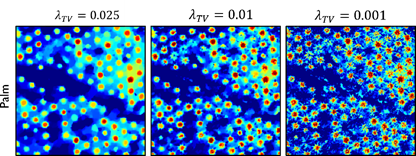
The SISAL regularization parameters were set to 𝜆 = 10, and the remaining parameters were set to 𝜏 = 1 and 𝜇 = 10-4. Fig. 4 shows the endmember signatures estimated by using SISAL (first column) and VCA (second column) for each scene. Note that the results of endmembers estimated by VCA in the three scenarios are very similar to those of SISAL. However, when abundances are estimated, the difference between VCA and SISAL is noticeable. Figures 5 and 6 show the abundances using the proposed method for the first and second scene, respectively, when the endmembers matrix is initialized using VCA (first row) and SISAL (second row). In optimal conditions, the algorithm without the pure pixel assumption offers a better performance. In the abundance results in the second row in Fig. 6, the red points indicate the oil palms detected by the proposed method and the blue spaces, other types of objects. Note that the proposed method achieves great oil palm identification results using SISAL, as opposed to when the endmembers are initialized with VCA. Furthermore, Fig. 7 shows the effect of the parameter 𝜆𝑇𝑉 on palm identification; the proposed method is applied to the dataset with three different values of 𝜆𝑇𝑉 = 0.025, 0.01, 0.001 and 𝑁𝑠 = 10. It can be seen that using 𝜆𝑇𝑉 = 0.01 yields better results than other cases.
Source: Authors’ own work.
Fig. 4 Endmember signatures estimated using SISAL (first column) and VCA (second column).
Source: Authors’ own work.
Fig. 5 Abundance maps of the first scene when matrix E is estimated using VCA (first row) and SISAL (second row).
Source: Authors’ own work.
Fig. 6 First three abundance maps of the second scene when matrix E is estimated using VCA (first row) and SISAL (second row).
3.3 Comparison with other methods
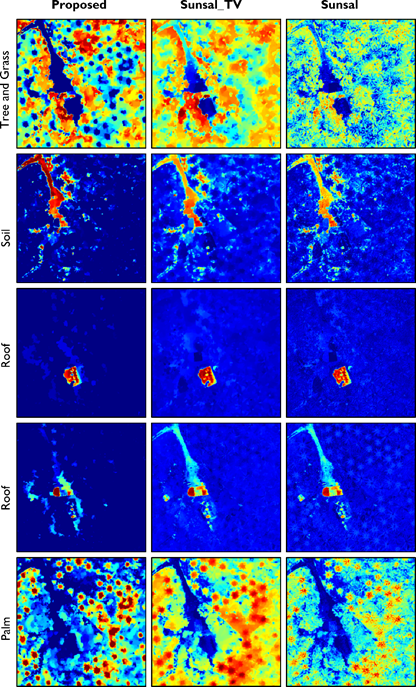
In this section, the proposed framework is compared with two state-of-art unmixing methods: SUnSAL [23] and SUnSAL TV [24]. Fig. 8 illustrates the performance of the proposed computational framework with the third scene. Comparisons with pure pixel estimation methods were conducted, and the obtained results shown the effectiveness of the proposed method to map oil palm plantations. It can be seen that this area is not homogeneous. Namely, it contains objects that are not oil palm trees, i.e., buildings, other trees, and shadows.
Source: Authors’ own work.
Fig. 8 Abundance estimation of the third scene by the proposed method (first column), SUnSAL TV (second column), and SUnSAL (third column).
Moreover, the SUnSAL and SUnSAL TV methods could merge some trees together due to the presence of spectral variability or when the distance between them is short. In that case, the regions obtained as palms and non-palms using the proposed method are quite evident.
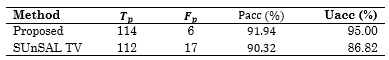
In addition to that, an oil palm detection procedure was applied for evaluation purposes. After the abundance maps of the oil palm plantation were estimated, oil palm detection was performed using the Circle Hough Transform (CHT) algorithm [26], the Producer Accuracy (Pacc) and User Accuracy (Uacc) by (8).
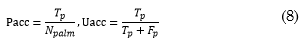
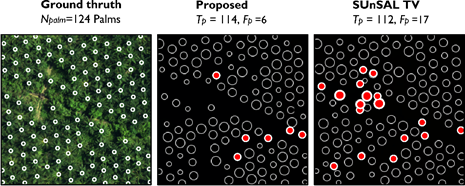
Where 𝑁𝑝𝑎𝑙𝑚 is the total number of palm trees in the image; 𝑇𝑝, the true positive detection indicating the number of detected palms trees; and F p , the false negative detection indicating the number of palm trees that were not detected (missed). Fig. 9 shows some palm and no-palm templates highlighted with circles bythe CHT algorithm. In the first image, the white circles represent the true location of oil palms. In the second and third images, the white circles represent T p , and the red circles represent F p , which are estimated from abundance map by the proposed method and SUnSAL TV, respectively. For example, the oil palms missing in the detection are marked with red circles. Oil palm trees can be missing from the detection because of the presence of other objects or tree crowns close together. Table 1 illustrates the detection results using different measurements. Note that the results suggest that the proposed method is the most promising strategy as preprocessing step before oil palm mapping.
Source: Authors’ own work.
Fig. 9 Palm detection results using the CHT algorithm. Actual ground (left), abundance map using the proposed method (middle), and using the SUnSAL TV method (right).
4. CONCLUSIONS
This study proposed a computational framework based on spectral unmixing to estimate the abundance fractions of oil palm plantations. As an additional contribution, the proposed approach considers the spectral variability of hyperspectral image signatures. The results of this study demonstrate that the proposed method is a promising technique as a tool for oil palm mapping, and it can be used to identify and mapping different oil palm plantations. Furthermore, an oil palm detection procedure was applied using the Circle Hough Transform (CHT) algorithm on the estimated abundances fractions. The detection results obtained with the proposed method, compared to a state-of-art alternative, show that the proposed approach is the most robust and provides better results. Finally, we encourage the scientific community in Colombia to conduct future research and develop applications using hyperspectral remote sensing, which will enable the adaptation and exploration of techniques to extract useful information from spectral data in Colombia or tropical countries.

