


 English (pdf)
 Article in xml format
 Article references
 Send this article by e-mail
 Cited by SciELO
  Cited by Google
  Similars in
SciELO
Similars in
SciELO  Similars in Google
 Permalink
1. INTRODUCTION
Remote sensing involves the use of sensors, systems, and models to characterize the Earth’s surface. The growing interest in this field is driving the development of optical sensors and platforms with different spatial, spectral, and temporal resolutions [1]-[3]. Among these platforms, are NASA’s Landsat 8 and the European Special Agency’s Sentinel 2, which include multispectral cameras that collect between 8 and 13 bands from the visible to the near-infrared spectral region [4]. The spectral response of a surface can be used to characterize materials and objects in the sensor’s field of view. Therefore, applications of multispectral remote sensing include cartography [5], meteorological studies [6], defense and security [7], mining [8], and agriculture [9]. Particularly, multispectral systems are relevant to precision agriculture because they can sense large crop fields; in addition, they provide information in several bands of the electromagnetic spectrum. Nevertheless, although the spectral response of the vegetation signature is one of the most studied, it is also one of the most complex to analyze [10].
Vegetation spectral signatures exhibit low reflectance in the visible region due to leaf pigments and chlorophyll absorption [10]. However, between 690 nm and 720 nm, vegetation spectra present a significant increase in reflectance, known as the red edge, which is the most discriminant feature in this region [10]. This increased reflectance is associated with the internal structure of leaves and water content. Moreover, in the near-infrared region, vegetation displays higher reflectance [10]. The shape of the spectral signature is influenced by the physiological and health conditions of the plants. Consequently, several methods have been used to relate the vegetation spectral response to environmental, geographic, and phenological conditions [11]- [13]. Said methods can be grouped into three approaches: vegetation indices (VIs), parametric models, and nonparametric models.
VIs are band ratios derived from the discriminant features of the vegetation spectrum [12]. They are typically based on two or four spectral bands, which makes them computationally efficient. VIs are commonly used to estimate leaf area, chlorophyll content, biomass, yield, and other attributes. The most widely employed VI is the Normalized Difference Vegetation Index (NDVI), a function of reflectance in the near-infrared and red spectral bands, which ranges from -1 to 1 [12], [14]. Studies have shown that the NDVI for a healthy plant is greater than 0.66. While VIs are widely used in the literature due to their simplicity in calculation from spectrometry and imaging data, caution should be exercised in their interpretation because they rely on a limited number of spectral bands.
An alternative to vegetation indices are parametric models, which explore the interaction of light with plants based on their biophysical characteristics [15]. These models describe spectral variation as a function of canopy, leaf, and soil properties [15]. Estimating biophysical characteristics involves an inversion process that minimizes the difference between real and simulated data. However, previous studies have shown that this inversion from remotely sensed data is computationally expensive and complex; in addition, it is limited by camera resolution [15]. Prominent examples of parametric or biophysical models include SAIL, which focuses on bidirectional canopy reflectance, and PROSPECT, which models the optical properties of leaves.
Unlike parametric models, nonparametric models do not require the assumption of band ratios or knowledge of data distribution. Instead, they employ methods such as neural networks, random forests, and support vector machines to extract biophysical models. For example, the authors of [16] used techniques based on Gaussian processes to analyze both each band and the entire spectrum for estimating biophysical parameters such as chlorophyll content, leaf area index, and canopy fraction [16]. The estimation of biophysical parameters from a set of relevant spectral bands reduces the computational costs associated with parametric methods while providing insights into the relationship of spectral signatures with the optical properties of plants.
Although there are few studies on the spectral response of avocado, the authors of [17] demonstrated that healthy and diseased trees with phytophthora can be classified using bands ranging from 400 nm to 950 nm from data collected in the laboratory. However, these results lack validation from field studies. In addition, in [18], hyperspectral imaging was used to characterize avocado ripening. Similarly, the authors of [19] employed spectral signatures ranging from 350 nm to 1,000 nm and VIs to classify healthy, asymptomatic, and symptomatic leaves infected with laurel wilt.
Despite the progress made in the study of the spectral response of vegetation, there is still a need for specific studies on its physiological, phenological, and health effects on signatures that consider the environmental conditions and the characteristics of the species. Thus, this paper aims to obtain a spectral characterization of avocado (Persea americana Mill. cv. Hass) using both spectrometry and multispectral imaging. The spectral characterization includes the comparison of some standard VIs and scale effects by using directly collected spectral signatures and satellite data.
2. MATERIALS AND METHODS
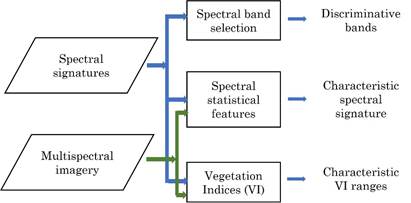
In this study, the spectral characterization of avocado (Persea americana Mill. cv. Hass) was performed at two scales. The first scale used spectral signatures directly collected from leaves in the visible to near-infrared region. This scale offers high spectral resolution but requires considering the differences between young and mature leaves. Signatures collected in farms were useful to understand the spectral response of avocado, identify relevant spectral bands, and analyze the behavior of VIs. The second scale analyzed multispectral satellite data with different spatial resolutions. Although this scale has lower spectral and spatial resolutions, it aims to provide a more general understanding of avocado’s spectral characteristics. This information can be used in future studies for estimation, detection, and monitoring of avocado crops. Figure 1 presents the methodology followed in this paper, which is described in detail in the following sections.
Source: Created by the authors.
Figure 1 Framework for establishing the spectral characterization of avocado (Persea americana Mill. cv. Hass) using spectral signatures and multispectral images in the visible and near-infrared region
2.1 Spectral data
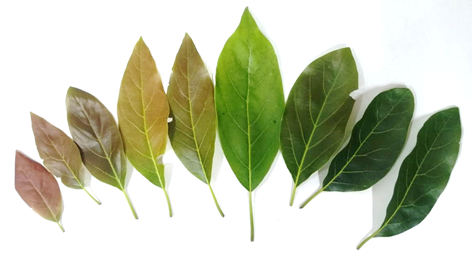
This study focused on the spectral response of Persea americana Mill. cv. Hass. This tree species is characterized by vigorous growth and lateral branching. The branches develop from axillary buds by internode elongation and enlargement and leaf expansion. The leaves of Persea americana Mill. cv. Hass exhibit different maturity stages distinguished by their color, size, and shape (Figure 2). The apical leaves of the branches are considered young leaves, emerging from breaking buds, stem nodes, or growing stem tips, with the petiole visible at the point of attachment to the stem. In contrast, mature leaves have achieved full size, darker green color, or tougher texture [20]. For this reason, both young and mature leaves were collected to study their spectral signature.
Source: Created by the authors.
Figure 2 Variability between young leaves (left side) and mature leaves (right side)
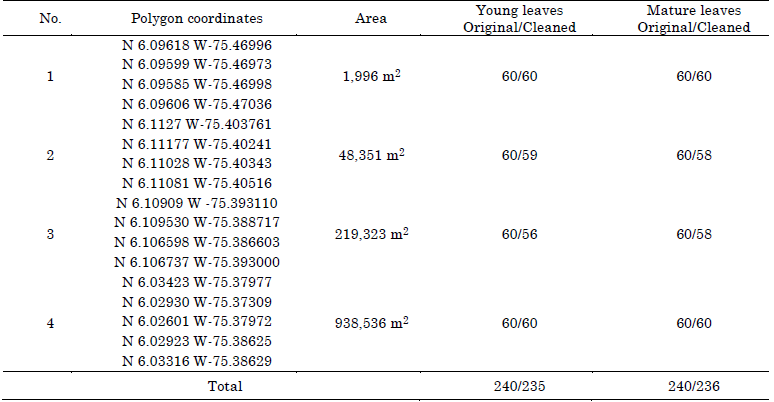
Leaf samples were collected from avocado trees in four farms located in eastern Antioquia (Colombia), between Rionegro and El Retiro. Table 1 provides the geolocation of the farms used in this study. A total of 60 young and 60 mature leaves were collected in each farm. Figure 2 shows the variability between young and mature leaves observed in the dataset, with the youngest leaves on the left and the oldest leaves on the right. Spectral signatures were captured using an Ocean Insight Flame-S-VIS-NIR-ES spectrometer and aQP600-2-VIS-BX fiber assembly. This device captures 2.048 spectral bands ranging from 339 nm to 1.028 nm, with a resolution of 1.33 nm. To reduce noise, ten spectral signatures were captured and averaged for each leaf sample.
For calibration, the spectral response of a white (r white ) and a black pattern (r black ) was captured before and after the collection. Finally, the reflectance (R(λ)) for each leaf was obtained using (1), where λ represents the wavelength and r is the measured radiance.
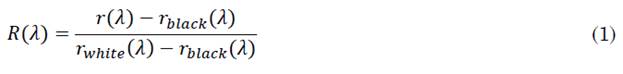
The spectral characterization of avocado (Persea americana Mill. cv. Hass) focused on spectral bands ranging from 480 nm to 900 nm due to the low signal-to-noise ratio observed in other spectral bands. The spectral signatures in this range were filtered using a uniform 10-point sliding window to reduce the noise and preserve the shape. Subsequently, the mean and standard deviations were calculated to remove corrupted signals from the collection. The final number of samples per farm is also listed in Table 1.
2.2 Multispectral imagery
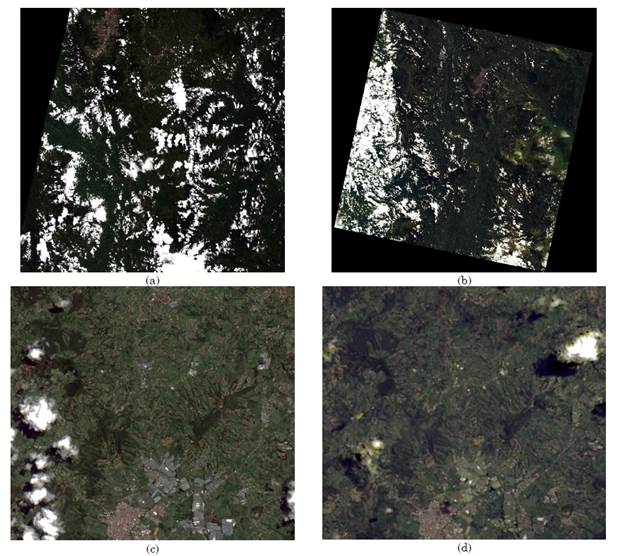
The spectral responses of avocado leaves collected in situ were compared with the spectral signatures captured by the multispectral satellite sensors Sentinel 2 and Landsat 8. Sentinel 2 is a mission of the European Space Agency (ESA) that comprises two polar-orbiting satellites equipped with multispectral cameras. The multispectral imagery consists of 13 bands ranging from 443 nm to 2,190 nm. The spatial resolution depends on the spectral band: 10-meter spatial resolution images are collected in B2 (490 nm), B3 (560 nm), B4 (665 nm), and B8 (842 nm); 30-meter imagery is collected in B5 (705 nm), B6 (740 nm), B7 (783 nm), B8a (865 nm), B11 (1,610 nm), and B12 (2,190 nm); while 60-meter spatial resolution imagery is captured in B1 (443 nm), B9 (940 nm), and B10 (1,375 nm). The Level-2A products of Sentinel 2 are freely available and include bottom reflectance with geometric and radiometric corrections. This study used the image captured on May 8, 2022. Figure 3a shows an RGB image composition using B4, B3, and B2 over the study area.
Source: Created by the authors.
Figure 3 RGB composition of (a) Sentinel 2 image captured on May 8, 2022, using B4 (665 nm), B3 (560 nm), and B2 (490 nm); (b) Landsat 8 image captured on January 8, 2022, using B4 red (650 nm to 670 nm), B3 green (530 nm to 590 nm), and B2 blue (450 nm to 510 nm). Image subset including the four farms from (c) Sentinel 2 and (d) Landsat 8. Images downloaded from Earth Explorer (https://earthexplorer.usgs.gov/)
For its part, Landsat 8, operated by NASA, features a multispectral system that measures from the visible to the shortwave infrared spectral range. Landsat 8 imagery comprises one panchromatic image with a spatial resolution of 15 meters (500 nm to 650 nm) and eight bands with a spatial resolution of 30 meters: B1 coastal aerosol (430 nm to 450 nm), B2 blue (450 nm to 510 nm), B3 green (530 nm to 590 nm), B4 red (650 nm to 670 nm), B5 near-infrared (850 nm to 889 nm), B6 SWIR 1 (1,570 nm to 1,650 nm), B7 SWIR 2 (2,110 nm to 2,290 nm), and B9 cirrus (1,350 nm to 1,380 nm). The data include the surface reflectance image obtained after atmospheric correction. This study used the image captured on January 8, 2022. Figure 3b shows an RGB composition using bands B4, B3, and B2. No low cloud cover images were found closer to the date of spectral signature collection.
2.3 Processing and analysis of spectral signatures
This study aims to perform a spectral characterization of avocado (Persea americana Mill. cv. Hass) in the visible to near-infrared region. The spectral signatures were collected from farms located in eastern Antioquia (Colombia) and subjected to three different analyses. The first analysis consisted of a statistical approach, where the spectra were separated by farm and the entire dataset was employed. The first and second-order statistics were then computed and the in situ spectral signatures were compared with the overall spectral response measured by Landsat 8 and Sentinel 2 systems.
Next, discriminative spectral bands were identified using subset band selection (SSBS) algorithms. Similarly, an algorithm based on singular value decomposition (SVD) proposed in [21] was also implemented. This unsupervised algorithm requires the number of bands (p) to be specified. Given the set of spectral signatures (S) as the input parameter, the algorithm computes the SVD of the covariance matrix of S and selects the first p eigenvectors. Then, a QR factorization is applied, pivoting over the set of selected eigenvectors. The first p elements of the pivoting are used as the most relevant bands.
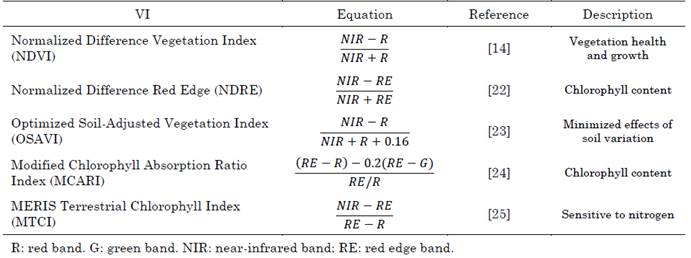
Finally, the behavior of the spectral signatures of avocado (Persea americana Mill. cv. Hass) leaves was determined using several VIs. Table 2 summarizes the VIs used in this paper, which employ wavelengths within the collected range and are known to be related to plant health. The VI calculations used the red (R), green (G), blue (B), red edge (RE), and near-infrared (NIR) bands. Thanks to the high resolution of the collected spectral signatures, it was possible to obtain the mean reflectance for the Landsat 8 wavelength ranges. Thus, the mean reflectance values were determined for B (450 nm to 510 nm), G (530 nm to 590 nm), R (630 nm to 670 nm), and NIR (850 nm to 880 nm). The range between 730 nm and 740 nm was used to calculate the reflectance of RE. A comparative analysis of the VIs obtained from in situ measurements and satellite data was carried out, focusing on the VI that could be calculated using Landsat 8 and Sentinel 2 imagery.
3. RESULTS AND DISCUSSION
3.1 Spectral characterization of avocado (Persea americana Mill. cv. Hass)
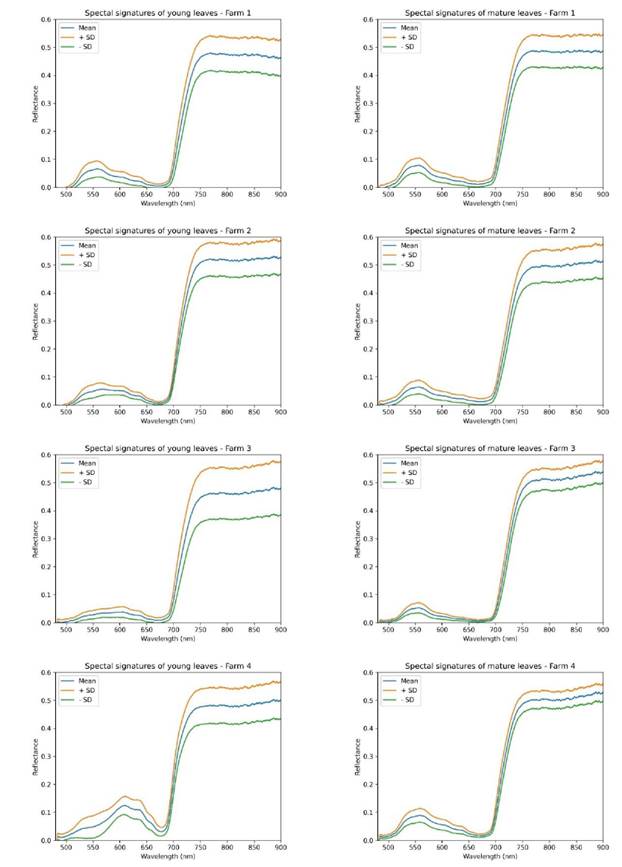
The spectral behavior of the avocado leaves collected from each farm was analyzed to establish differences between young and mature specimens. Figure 4 shows the mean spectral signatures and standard deviations for young (left column) and mature (right column) leaves. In Farm 1, the reflectance peak, attributed to leaf pigments, occurred at 550 nm for both young and mature leaves, while the red edge started before 700 nm and extended to 750 nm. For Farms 2, 3, and 4, Figure 4 shows differences between young and mature leaves. For instance, chlorophyll absorption increased from 600 nm for young leaves and from 550 nm for mature leaves.
Source: Created by the authors.
Figure. 4 Spectral signatures of avocado (Persea americana Mill. cv. Hass) for each farm. Left column: young leaves. Right column: mature leaves. +SD: mean spectrum plus one standard deviation. -SD: mean spectrum minus one standard deviation
Moreover, Figure 4 shows a higher standard deviation for young leaves compared to mature leaves. Generally, at 550 nm, the spectral signature exhibits more significant qualitative variations between young and mature leaves. This is due to mature leaves displaying a deep dull green color, while young leaves show a wide range of colors, including brown, reddish, light green, yellow, or a combination of them in the same leaf.
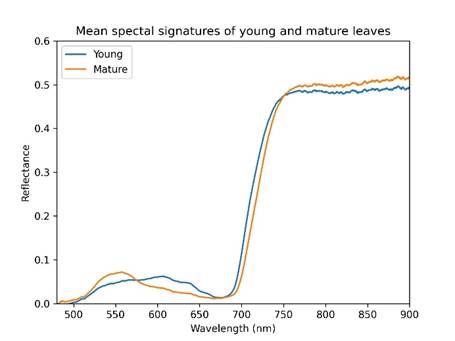
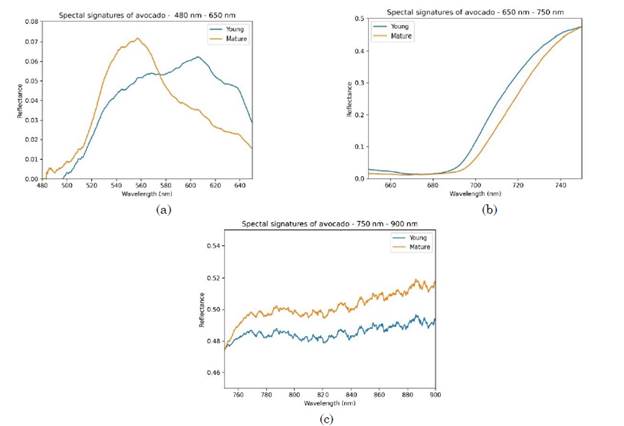
An analysis of the entire dataset was conducted independent of specific farms. Figure 5 compares the mean spectral signatures obtained from both young and mature leaves. Considering all wavelengths, the cosine distance similarity between these signatures was calculated to be 0.9974. Furthermore, Figure 6 displays the differences between three spectral regions: (I) 480 nm to 650 nm (Figure 6a), (II) 650 nm to 750 nm (Figure 6b), and (III) 750 nm to 900 nm (Figure 6c).
Source: Created by the authors.
Figure 5 Comparison of spectral signatures of young and mature leaves of avocado (Persea americana Mill. cv. Hass)
Source: Created by the authors.
Figure 6 Detailed comparison of spectral signatures of young and mature leaves of avocado (Persea americana Mill. cv. Hass) in the different spectral ranges: (a) 480 nm to 650 nm, (b) 650 nm to 750 nm, and (c) 750 nm to 900 nm
Within the visible region, the main differences between young and mature leaves can be observed between 480 nm and 650 nm (similarity of 0.9160). In this region, associated with leaf pigments and chlorophyll absorption, young leaves exhibit higher reflectance near 550 nm, while mature leaves show increased reflectance near 600 nm. In the red edge region (650 nm to 750 nm), a shift was observed at the beginning of the range (similarity of 0.9934). Finally, the near-infrared region (650 nm to 750 nm) displayed only differences in amplitude (similarity of 0.9999). Avocado trees are characterized by having different phenological stages in their crowns. For instance, in commercial plantations, a plant can simultaneously present development and fruiting stages. Consequently, the foliage of different colors can coexist within the same plant.
3.2 Comparison of spectral signatures from in situ measurements and satellite data
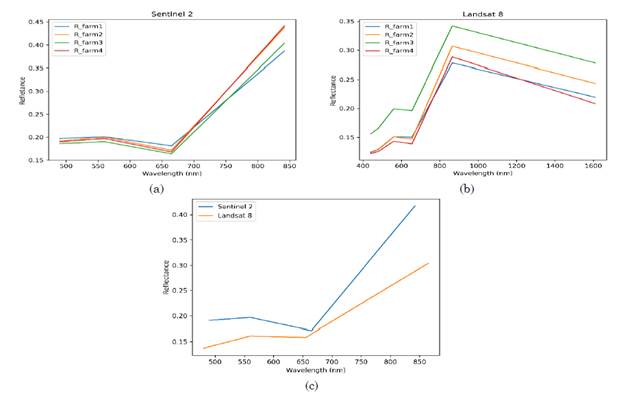
The spectral signatures were obtained from satellite imagery collected by Sentinel 2 and Landsat 8. Figure 7(a) presents the spectral signatures captured by Sentinel 2 for the four farms in the bands B2, B3, B4, and B8, which have a spatial resolution of 10 meters.
Similarly, Figure 7(b) presents the signatures obtained with the five bands of Landsat 8 (B1, B2, B3, B4, B5), whose spatial resolution is of 30 meters. At this analysis scale, differences between young and mature leaves cannot be observed. In addition, Figure 7(c) compares the mean spectra captured by Sentinel 2 and Landsat 8, considering all four farms. The signatures exhibit variations between the two sensors, which can be related to the collection date, atmospheric and radiometric corrections, and spatial resolution, among other factors.
3.3 Spectral band selection
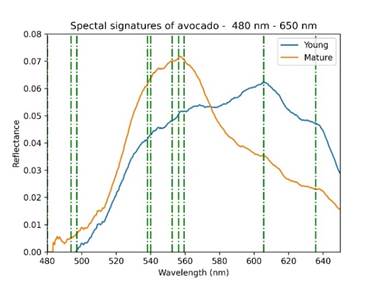
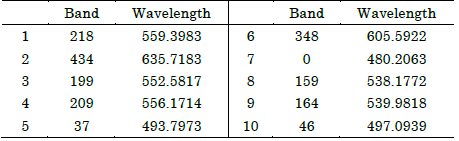
A comparison between the results obtained from satellite data and close-range spectrometry revealed differences at these two scales. While satellite sensors include bands for vegetation characterization, such as the NIR and red bands, their lower spatial and spectral resolutions limit plant analysis. Consequently, this study employed SSBS algorithms to identify relevant bands for avocado spectral signatures. The findings described in Section 3.1 suggest that the visible range is relevant for this plant. Likewise, the unsupervised SSBS algorithm based on SVD was used to validate these results. Table 3 presents the ten most relevant bands selected by the SVD-based algorithm. Moreover, Figure 8 shows the spectral signatures of young and mature avocado leaves, with the selected bands overlaid. It is worth noting that these ten bands are between the range of 480 nm and 650 nm. Furthermore, Figure 8 identifies five regions of relevance: near 500 nm, 540 nm, 560 nm, 610 nm, and 630 nm.
Source: Created by the authors.
Figure 8 Spectral signatures of young and mature leaves of avocado (Persea americana Mill. cv. Hass) ranging between 480 nm and 650 nm, with the relevant bands selected by the SVD-based algorithm
3.4 Vegetation Indices
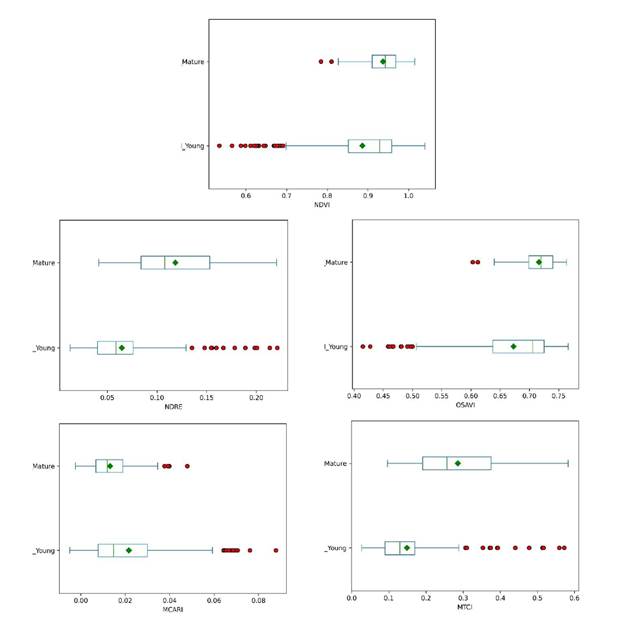
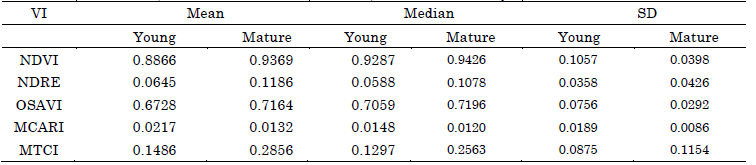
Figure 9 compares the VIs obtained from young and mature avocado leaves using in situ measurements. Table 4 lists the mean, median, and standard deviation (σ) values of the calculated VIs.
Source: Created by the authors.
Figure 9 Vegetation indices for young and mature leaves of avocado (Persea americana Mill. cv. Hass)
Table 4 Mean, median, and standard deviation of vegetation indices for young and mature leaves of avocado (Persea americana Mill. cv. Hass)
Source: Created by the authors
Figure 9 shows that of the NDVI, OSAVI, and MCARI values exhibit a higher dispersion among young leaves compared to mature ones. For instance, the NDVI mean value for young leaves was 0.8866 with σ = 0.2057, whereas for mature leaves it was 0.9369 with σ = 0.0398. Conversely, the NDRE and MTCI values reached higher dispersions among mature leaves compared to younger ones. Specifically, the NDRE mean value for young leaves was 0.0645 with σ = 0.0358 and, for mature leaves, it was 0.1186 with σ = 0.0426. The outliers shown in Figure 9 represent the wide range of colors observed in young leaves, with some exceptions in mature leaves, mainly due to the brightness of the deep green color.
3.5 Comparison of vegetation indices derived from satellite data
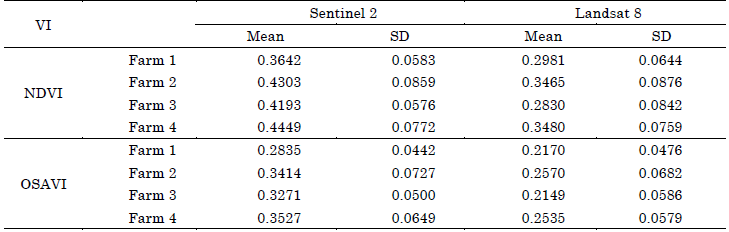
Table 5 presents the NDVI and OSAVI values obtained from spectral signatures derived from multispectral satellite imagery. In this case, the NDVI obtained for the avocado farms was around 0.4 using Sentinel 2 and around 0.3 using Landsat 8. These values are considerably lower than the value of 0.9 obtained for close-range signatures, which may be due to limitations in the spectral and spatial resolutions and to atmospheric effects.
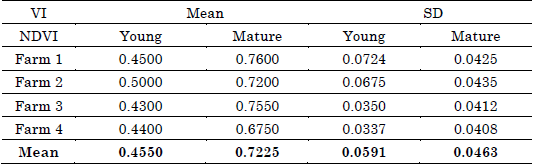
3.6 Comparison of vegetation indices measured with GreenSeeker
Table 6 presents the mean and standard deviation of the NDVI measurements recorded by the GreenSeeker sensor. Using this instrument, the mean for mature leaves was around 0.7225 and, for young leaves, it was around 0.4550. These measurements are lower than those estimated from spectral signatures collected by the field spectrophotometer. However, differences in NDVI between young and mature leaves are evident, which demonstrates the sensitivity of the instrument. As explained in [26], the GreenSeeker sensor helps to determine differences in a simple numerical index such as NDVI, which reflects the physiological state of crops in the field.
3.7 Discussion
The present study makes significant contributions to the spectral characterization of avocado (Persea americana Mill. cv. Hass) in the visible to near-infrared range, the identification of discriminative wavelengths, and the quantification of VIs for this crop. To our knowledge, no spectral characterization of avocado in the visible to near-infrared region has been published.
Previous studies have used Sentinel 2 images of avocado crops [27], but they have not analyzed their spectral behavior. For example, the authors of [18] described the spectral response of avocado fruit in the near-infrared range. In contrast, we analyzed the spectral response of avocado trees both in the near-infrared range and from space-borne platforms. The results suggest a dependence between leaf maturity and signature shape in the visible range that should be considered in future analyses.
Avocado plants can present different phenological stages simultaneously, including vegetative growth, flowering, and fruit production [28]. This condition causes natural changes in the spectral response of the plant, even without being subjected to biotic or abiotic stress. The spectral characterization conducted in this study may be useful for studying the linear relationship between biomass production and Leaf Area Index (LAI) in non-stressed crops, as suggested in [29]- [31]. Future studies could further explore this relationship.
Regarding the spectral characterization from multispectral satellite imagery, there is little consistency between the data captured by Sentinel 2 and Landsat 8. Despite both selected images undergoing geometric, radiometric, and atmospheric corrections, differences in collection dates, preprocessing algorithms, and spatial and spectral resolutions can affect the obtained signatures. Thus, the close-range signatures obtained in this study can be used as a reference in studies of diseases, physiological states, and other phenomena in avocado crops. Nevertheless, caution must be exercised when conducting local analyses within crops using satellite data, considering the low spatial and spectral resolutions, as well as the dependence on preprocessing methods. Accurately discriminating on-field avocado plants from other crops or soil covers using remote sensors remains a challenge due to the lack of specific imagery libraries for each phenological stage, stress condition, or interaction.
The results indicate that bands around 490 nm, 540 nm, 560 nm, 605 nm, and 635 nm play a major role in the spectral characterization of avocado. It is important to note that the band selection approach employed in this study was unsupervised, that is, it sought to reduce information redundancy by identifying discriminant bands. It is worth highlighting the coherence between the bands selected by the SVD algorithm and the results obtained analytically from the signatures, where the spectral difference between young and mature leaves in the visible region of the spectrum was established. These discriminant bands can be used in the future for the development of cost-effective monitoring systems that capture a limited number of bands while enabling the discrimination of different phenomena in plant leaves. In addition, it is crucial to identify bands associated with stress factors and phenology to improve the prediction of VIs, considering that the reflectance of stressed plants should be related to variables such as LAI, cover, optical properties of phyto-filaments, and soil conditions [30], [31]. Consequently, this study lays the foundation for generating new VIs using discriminative spectral bands specific to avocado commercial plantations.
NDVI is widely employed in agricultural systems to assess physical plant factors using correlation and regression analyses. However, this study revealed a significant variance in NDVI when applied to young avocado leaves, highlighting its sensitivity to the physiological stages of plants. The results also demonstrated that VIs, including NDVI and OSAVI, varied depending on the type of sensor used. The above underscores the need for new methods considering additional spectral information rather than only two to four bands. It is also important to note that, in crops other than avocado, VIs may offer more accurate results. For example, in the case of the common bean (Phaseolus vulgaris), which exhibits a homogeneous spectral signature across different phenological stages, VIs may provide reliable representations of field conditions [31]. However, in avocado, the presence of numerous structures at different phenological stages, such as flowers, fruits, leaves of varying ages, and other components, make spectral analysis difficult.
4. CONCLUSIONS
This paper presents a characterization of the spectral response of avocado (Persea americana Mill. cv. Hass) from signatures captured in the visible to near-infrared region. A total of 60 young and 60 mature leaves were collected for analysis from four farms located in Antioquia (Colombia). The spectral signatures were compared with data from multispectral images captured by Sentinel 2 and Landsat 8. In addition, the behavior of different VIs was analyzed.
The close-range spectral signatures revealed a spectral difference between young and mature avocado leaves. This difference was predominant in the range from 450 nm to 650 nm; moreover, a shift in the red edge was observed. The unsupervised band selection algorithm, based on singular value decomposition, classified the range from 480 nm to 650 nm as the most discriminant for spectral characterization.
Conversely, spectral characterization using satellite data posed some challenges. The signatures collected by Sentinel 2 and Landsat 8 displayed significant variations that can be related to collection dates, spatial resolutions, and radiometric and atmospheric corrections of each system. In the case of Sentinel 2, an image with low cloud cover (less than 30%) was captured on May 8, 2022. However, the closest Landsat 8 image with low cloud cover was obtained on January 8, 2022. In addition, the analysis was based on Sentinel 2 bands with a 10-meter spatial resolution, whereas the Landsat 8 bands had a spatial resolution of 30 meters. This implies that the pixels representing the characteristic spectral signatures exhibited a mixture of materials. Although both images had radiometric and geometric corrections, the signatures varied significantly.
The analyzed VIs also highlighted the differences between young and mature leaves in the spectral characterization using close-range spectrometry. The NDVI values achieved were close to 0.9, but younger leaves showed significant deviations. Similar behaviors were observed in MCARI and OSAVI. However, regarding satellite data, we could compute only two VIs that used the available spectral bands. In this case, the NDVI values were around 0.4 for Sentinel 2 and 0.3 for Landsat 8. It is worth mentioning that NDVI is today the most widely used index in vegetation studies because it can be calculated from signatures or satellite images; in addition, it can be measured using instruments such as GreenSeeker sensors. Nonetheless, the results of this study demonstrate the differences in scale that can be obtained for this index according to the type of data (in situ or remote). This should be considered in future agronomic studies based on vegetation indices.
The spectral characterization obtained in this study offers valuable insights for the detection of diseases and stresses in avocado (Persea americana Mill. cv. Hass) plants. The relevant spectral bands (around 490 nm, 540 nm, 560 nm, 605 nm, and 635 nm) identified in this study can be used to develop specialized devices for the analysis of avocado plants. Furthermore, vegetation indices provide reference values for different observation scales (close-range and satellite-based), facilitating further precision agriculture studies in the context of avocado cultivation.

