


 Inglés (pdf)
 Articulo en XML
 Referencias del artículo
 Enviar articulo por email
 Citado por SciELO
  Citado por Google
  Similares en
SciELO
Similares en
SciELO  Similares en Google
 Permalink
Introduction
Data transport has experienced a significant increase in its capacity due to the use of optical fiber as the underlying physical layer platform in current transport network deployments. The characteristics of the optical fiber allow having greater bandwidth and lower attenuation as compared to traditional copper-based transmission lines. In the context of a transport network, one of the key elements needed and widely used is the Erbium Doped Fiber Amplifier (EDFA) [1-3].
The EDFA compensates the attenuation imposed by the fiber. One of the main particularities of the EDFA is the non-uniform gain spectrum, which results in distortions of the signal and penalties to the signal-to-noise ratio that restricts the usable transmission bandwidth [4-5]. To correct the non-uniform gain of the EDFA amplifier, a gain flattening filter is normally used. To date, different approaches to flatten the non-uniform gain of an EDFA have been proposed. Companies such as Lumentum and Iridian provide solutions mainly based on the use of thin-film filters in order to equalize the non-uniform gain of the EDFA [6-7]. Related works have also included the use of a model that employs a hybrid optical amplifier consisting of an EDFA and a Raman amplifier proposed for a 20x50 Gbps WDM system [8]. In this context, Fiber Bragg Gratings (FBG) have also drawn attention as a filtering method to flatten the EDFA gain because of its low losses, wide bandwidth, low group delay, insensibility to Polarization Mode Dispersion (PDL) and direct compatibility with the optical fiber. Thus, a system with Two Long-Period Fiber Gratings (LPFGS) equipped with divided coil heaters controlled individually to maintain optimum gain-flatness for different EDFA operation condition was proposed in [9]. However, one of the facts that prevent the popularization of this kind of filter lies in the use of a dedicated FBG per wavelength channel. This paper explores the feasibility and impact of using a reduced number of FBG for a given number of optical carriers on the link.
In this context, taking advantage of the ability of neural networks to emulate systems, an artificial neural network (ANN) is proposed in order to determine the best possible response of a flattening filter based on FBG in a WDM link that transports eight C-band carriers. A related work about the use of artificial neural networks in the context of EDFAs and WDM transport is described in [10]. This proposal is based on the fact that an ANN allows emulating systems that do not have an identifiable model, provided that a basic set of input and output data of such system is available. Thus, with a sufficiently large database of inputs and outputs of the optical system, an approximation to its behavior can be modeled and a regression analysis can be performed. This will allow emulating the outputs of the system from known inputs and define the necessary inputs for a desired output.
This work aims to demonstrate the capacity of an artificial neural network to assist the design of a cost effective optical WDM system by reducing the optical components required to get a flatten gain, while assuring suitable performance in terms of transported signal quality.
Materials and Methods
Fiber Bragg Grating
FBGs arose from the discovery of the photosensitivity property of optical fibers. These devices are able to perform filtering functions with low attenuation and low differential group delay. In its most generic form, an FBG consists of periodic modulation of the core refractive index of an optical fiber. In a uniform FBG, the refractive index of the fiber core varies periodically along the length of the fiber as seen in Fig. 1.
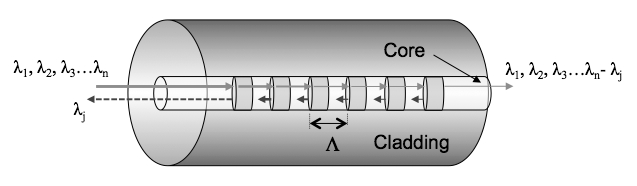
The Bragg wavelength is defined as:

Where neff is the effective refraction index of the grating and Λ is the grating period. Thus, a wavelength that matches the Bragg wavelength is reflected while the rest of optical spectra are transmitted along the grating. In this context, the FBG features a band-reject filtering profile that can be exploited in order to shape a tailored band-stop profile by cascading different FBGs operating at different Bragg wavelengths.
Artificial Neural Network
An ANN is a system that emulates the configuration of biological neural networks, which consist of many simple processors (neurons) connected together by layers, each producing a sequence of activations of a real value [12-14]. ANNS see any system as a black box, where current inputs determine the outputs of the system. For a single neuron, its output is given by:

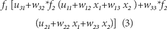
Where u is a bias level, f is the activation function of the neural network, x are the inputs and w are the weights for each one of the inputs. In the case of a neural network, inputs can act as the output of another neuron. For the particular case of a neural network with two inputs, two neurons in the input layer and a neuron in the output layer is defined as:
In order to train the neural network, the activation function that governs the operation of the network must be linear and easily derivable. In this context, three different activation functions have been defined, namely, direct relationship (purelin), sigmoid hyperbolic tangent (tangsig), and logarithmic sigmoid (logsig) [15]. As our system only manage positive values in both inputs and outputs, the logsig function will be used in all layers. The logarithmic sigmoid function logsig is defined as:

With its derivative defined as:

Because the logsig function is defined between 0 and 1, it is necessary to normalize the values of inputs using the equation:
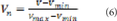
Where Vn is the normalized value, Vmin is the minimum value of the input and Vmax is the maximum value of such input. outputs of the neural network will also be defined between 1 and 0, thus it is necessary to denormalize outputs, using the inverse of eq. (6) as:

Simulation Setup
Training a neural network requires a database that must be as large as possible in order to emulate the system and avoid problems due to bias in data. For such purpose two tests were carried out in Optisystem, the general layout is shown in Fig. 2. A WDM transmitter generating eight channels that transport 10 Gbps Non-Return-to-Zero (NRZ) encoded data launches the optical carriers to the fiber link. The optical power of each carrier is 1 mW. An EDFA amplifies the signals and subsequently a FBG filter-based flattening filter is used to equalize the non-uniform gain of the EDFA. The dual port WDM analyzer collects and stores the optical power of the eight carriers measured before and after propagation through the FBGs. While in the first test the flattening filter for the eight carriers uses three FBGs as seen in Fig. 2, in the second test the flattening gain system uses six FBGs. For the first test, the database was completed after 948 running simulations in which the optical power of the eight carriers is collected based on the configuration of two relevant parameters, namely, FBG central frequency and its physical length. In this test, the operating frequency of three FBGs was evaluated between 192.5-196.1 THz and the FBG filtering response based on its length was evaluated from values ranging between 1-40 mm. The second test includes the assessment of a system based on six FBGs evaluated between 189-197,783 THz and a physical length between 1-40 mm, whose database is defined through 1920 simulations.
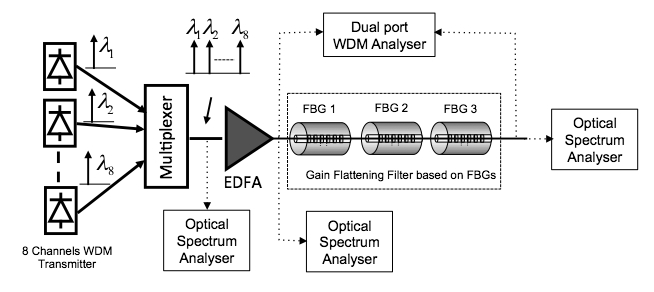
In this context, ANN inputs are the central frequency of the eight optical carriers defining a band of 1.4 THz located between 195-196.4 THz with a frequency spacing of 200 GHz between carriers. These inputs have a direct relation with the technical considerations of the FBG design, as their resonances must be allocated into the 1.4 THz band; however, the central frequency of an FBG resonance is not necessarily the central frequency of an optical carrier. In fact, this represents the main motivation of this work since it deals with the definition of physical parameters for a number of filters fewer than that of optical carriers in order to optimize the resources that make up a flattening filter response.
Data Processing
After having completed the database, a Matlab code is implemented and executed in order to define the best internal structure of the neural network. The code performs the following procedures:
The database is loaded into the program where each element of the database consists of 14 values: 8 inputs (8 optical carriers) and 6 outputs (length and central frequency for the three-FBGs-based flattening filter).
The loaded data is normalized.
Database elements are randomly divided into 70% for training and 30% for validation in order to avoid overtraining.
Inputs and their respective outputs are separated for both training and validation data elements.
Different neural networks with an m-n-6 structure are created, where n varies between 6 and 20, and m varies between 6 and 30.
Each of the neural networks created is trained. The training of the neural network begins with a random synaptic weight where the neural network is simulated with the eight inputs of the first database element. Then, the generated outputs are compared with the expected ones and the derivative of the error is found with respect to each weight. Then, each weight is corrected with respect to its own error derivative according to eq. (4) and eq. (5), respectively. Subsequently, an iterative set of simulations with the rest of the database elements is performed. It is worth to point out that the creation of the ANN was adjusted to 3,500 iterations to avoid overtraining. Also, bias is an input of each neuron that is used as a constant value for the function of the neuron. It has its own weight that multiplies it and therefore its error derivative is also calculated. Finally, the bias is also modified in each iteration.
-
The total error validation for each ANN is performed using the Mean Square Error (MSE) as follows:
Where Errto is the total error of the neural network, So is the output “o” of the neural network, and Yo is the correct output. There are six outputs for each of the 288 validation data whose expected outputs were already known.
The total validation error and neural networks are stored.
As the error function is overly complex due to the nature of the ANN, it might get stuck in a local minimum in the training stage. For this reason, it is necessary to train several neural networks in order to try to find the global minimum of the error function.
Results
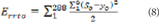
After executing the code, the data are organized and analyzed by averaging the results in which the lowest MSE was found. Fig. 3 shows the contour graph that represents the MSE measured based on the number of neurons in both the input and intermediate layers. The results show that the lowest MSE corresponds to the ANN structure 7-10-6, i.e. 7 neurons in the input layer, 10 neurons in the intermediate layer and 6 neurons in the output layer as described above.
Once the structure is chosen, 50 ANNS with the structure (7-10-6) were generated and trained. Each one of them creates a different equation to simulate the system. Thus, there will be some ANNS that simulate the system better than others. Due to the amount of time it takes to build each ANN, it was considered that 50 were an amount large enough to obtain an ANN that would properly simulate the system. Subsequently, the 50 ANNS are assessed to find out the one that had the lowest validation error. Once the ANN that best simulates the three FBGs system is found, the gain for each one of the eight optical carriers is introduced. In our approach we defined a flat gain of 26 dB for the optical carriers. Finally, the outputs provided by the code are both the physical length of the FBG and the operation frequency that the three FBGs must have in order to assure the targeted gain.
Once the characteristics of the FBG are obtained, these values are introduced in Optisystem, where the values are used as a base and are slightly modified in order to obtain a better response in gain. The best response is considered taking into account three parameters: mean square error, standard deviation and average deviation with respect to the desired value of 26 dB for all of the eight carriers. Table 1 presents the results for the synthesis of the flattening filter based on three FBGs. The results show that frequency spacing between the resonances of the first and second FBG is 200 GHz and between the second and the third FBG is 370 GHz. Table 2 shows the measured MSE featured by the non-equalized system, i.e. the EDFA gain, the flattening filter based on three FBGs and the conventional flattening filter with respect to a target constant gain of 26 dB. The improvement factor is defined as the fraction between MSE performed by the system without equalization and the MSE featured by the flattening filter techniques.
Table 1. Characteristics found for the flattening filter based on three FBG s.
|
FBG 1 |
FBG 2 |
FBG 3 |
|||
|---|---|---|---|---|---|
| Frequency (THz) | Length (mm) | Frequency (THz) | Length (mm) | Frequency (THz) | Length (mm) |
|
195.59 |
14 |
195.79 |
13 |
195.42 |
33 |
Table 2. Mean square error for the flattening filter based on three FBGs
|
Mean Square Error (MSE) |
Improvement factor* |
|
|---|---|---|
|
Without equalization |
90.06606394 |
|
|
Flattening filter based on three FBGs |
4.865838017 |
18.50987715 |
|
Standard flattening filter |
0.33108696 |
272.031 |
*With respect to the EDFA gain without equalization
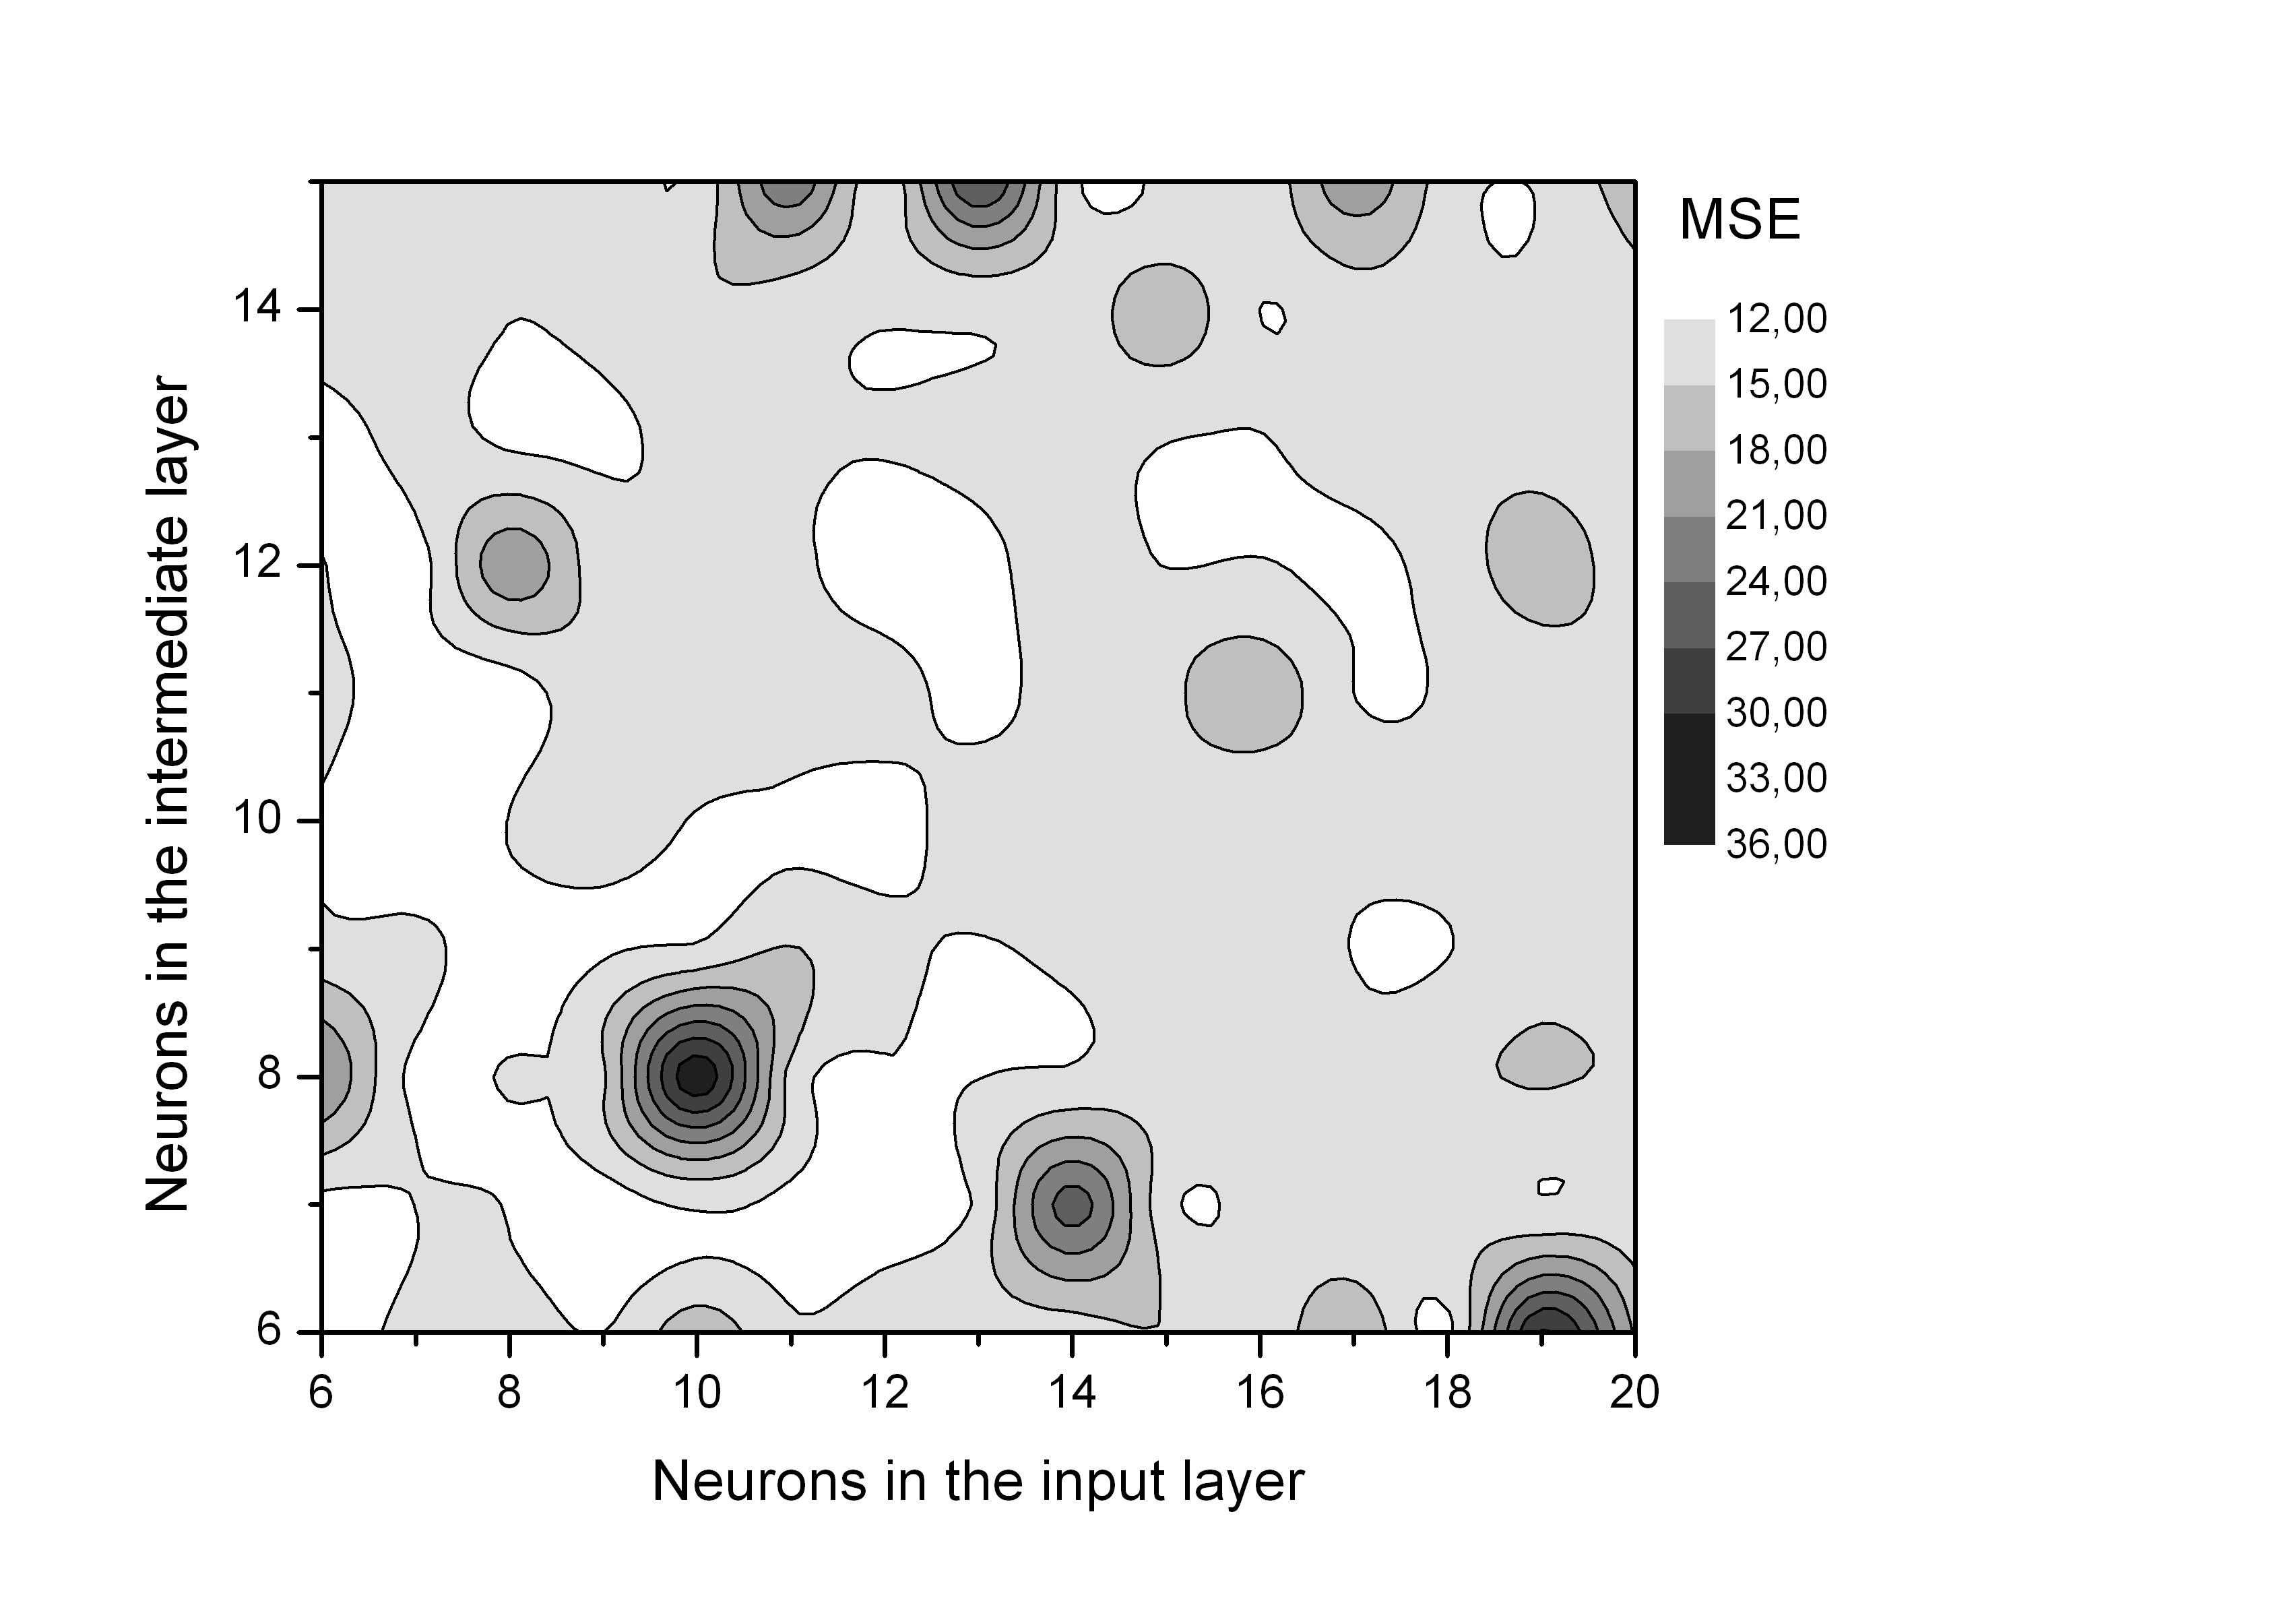
Notice that while the approach based on three FBGs improves the gain response of the EDFA by a factor of 18.5, the standard flattening filter improves it by a factor of 272. This behavior can be observed in Fig. 4 where the gain response for a system without equalization is depicted along with the response of a standard flattening filter and the approach based on three FBGs, all of them contrasted against the targeted flatten gain of 26 dB within the evaluated frequency band.
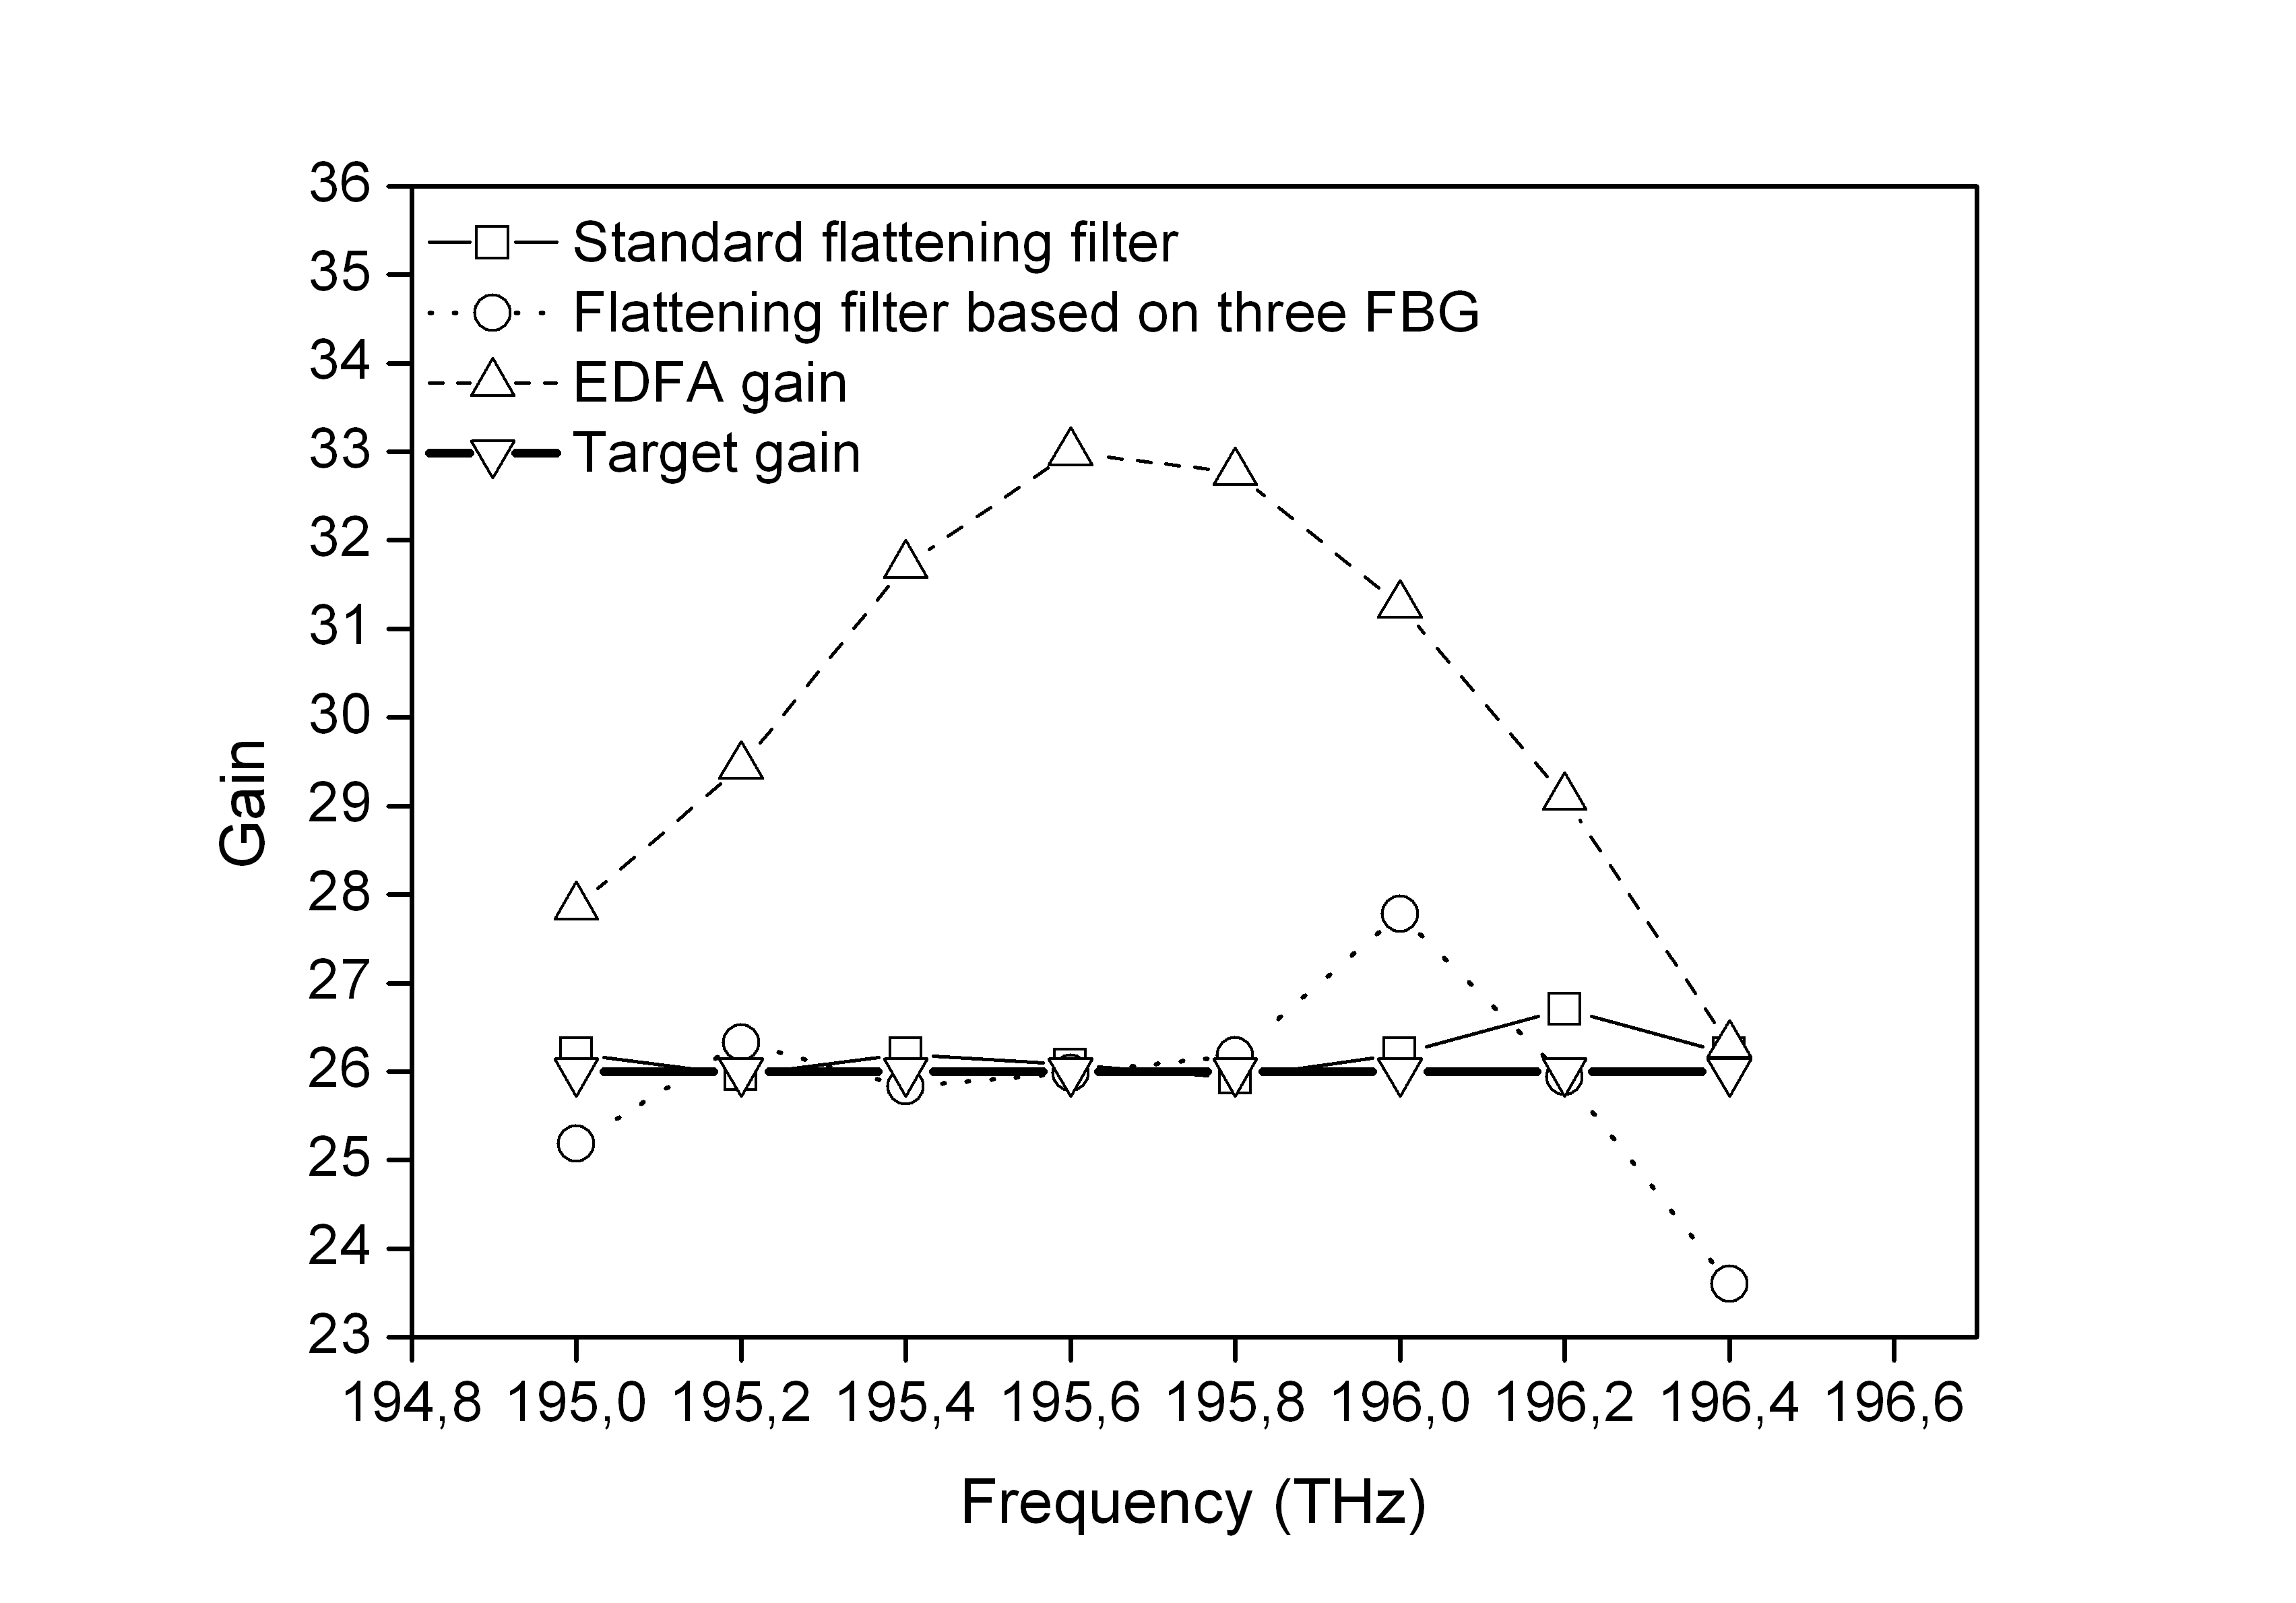
Fig. 4. Gain as function of frequency for a system without equalization (dashed line), with a standard flattening filter (thin solid line), flattening filter based on three FBGs (dotted line), and the target gain at 26 dB (bold solid line).
In the second test, the flattening filter is replaced with the approach based on six FBGs evaluated between 189-197,783 THz and physical length between 1-40 mm. Subsequently, the optical power of each one of the eight carriers was registered. Obtaining the data requires a large amount of time since it requires a simulation and transcription process, for this reason the data was collected until the amount was considered adequate for the ANN to simulate the system. For this test, 1,920 simulations were performed in order to obtain the database. Then, after following a similar procedure as that performed for the system based on three FBGs, the data were organized and represented in Fig. 5. Results show that a suitable value of MSE is given by a 25-18-12 ANN structure; that is, 25 neurons for the input layer, 18 neurons for the intermediate layer and 12 neurons for the output layer (length and central frequency for the system based on six FBGs).
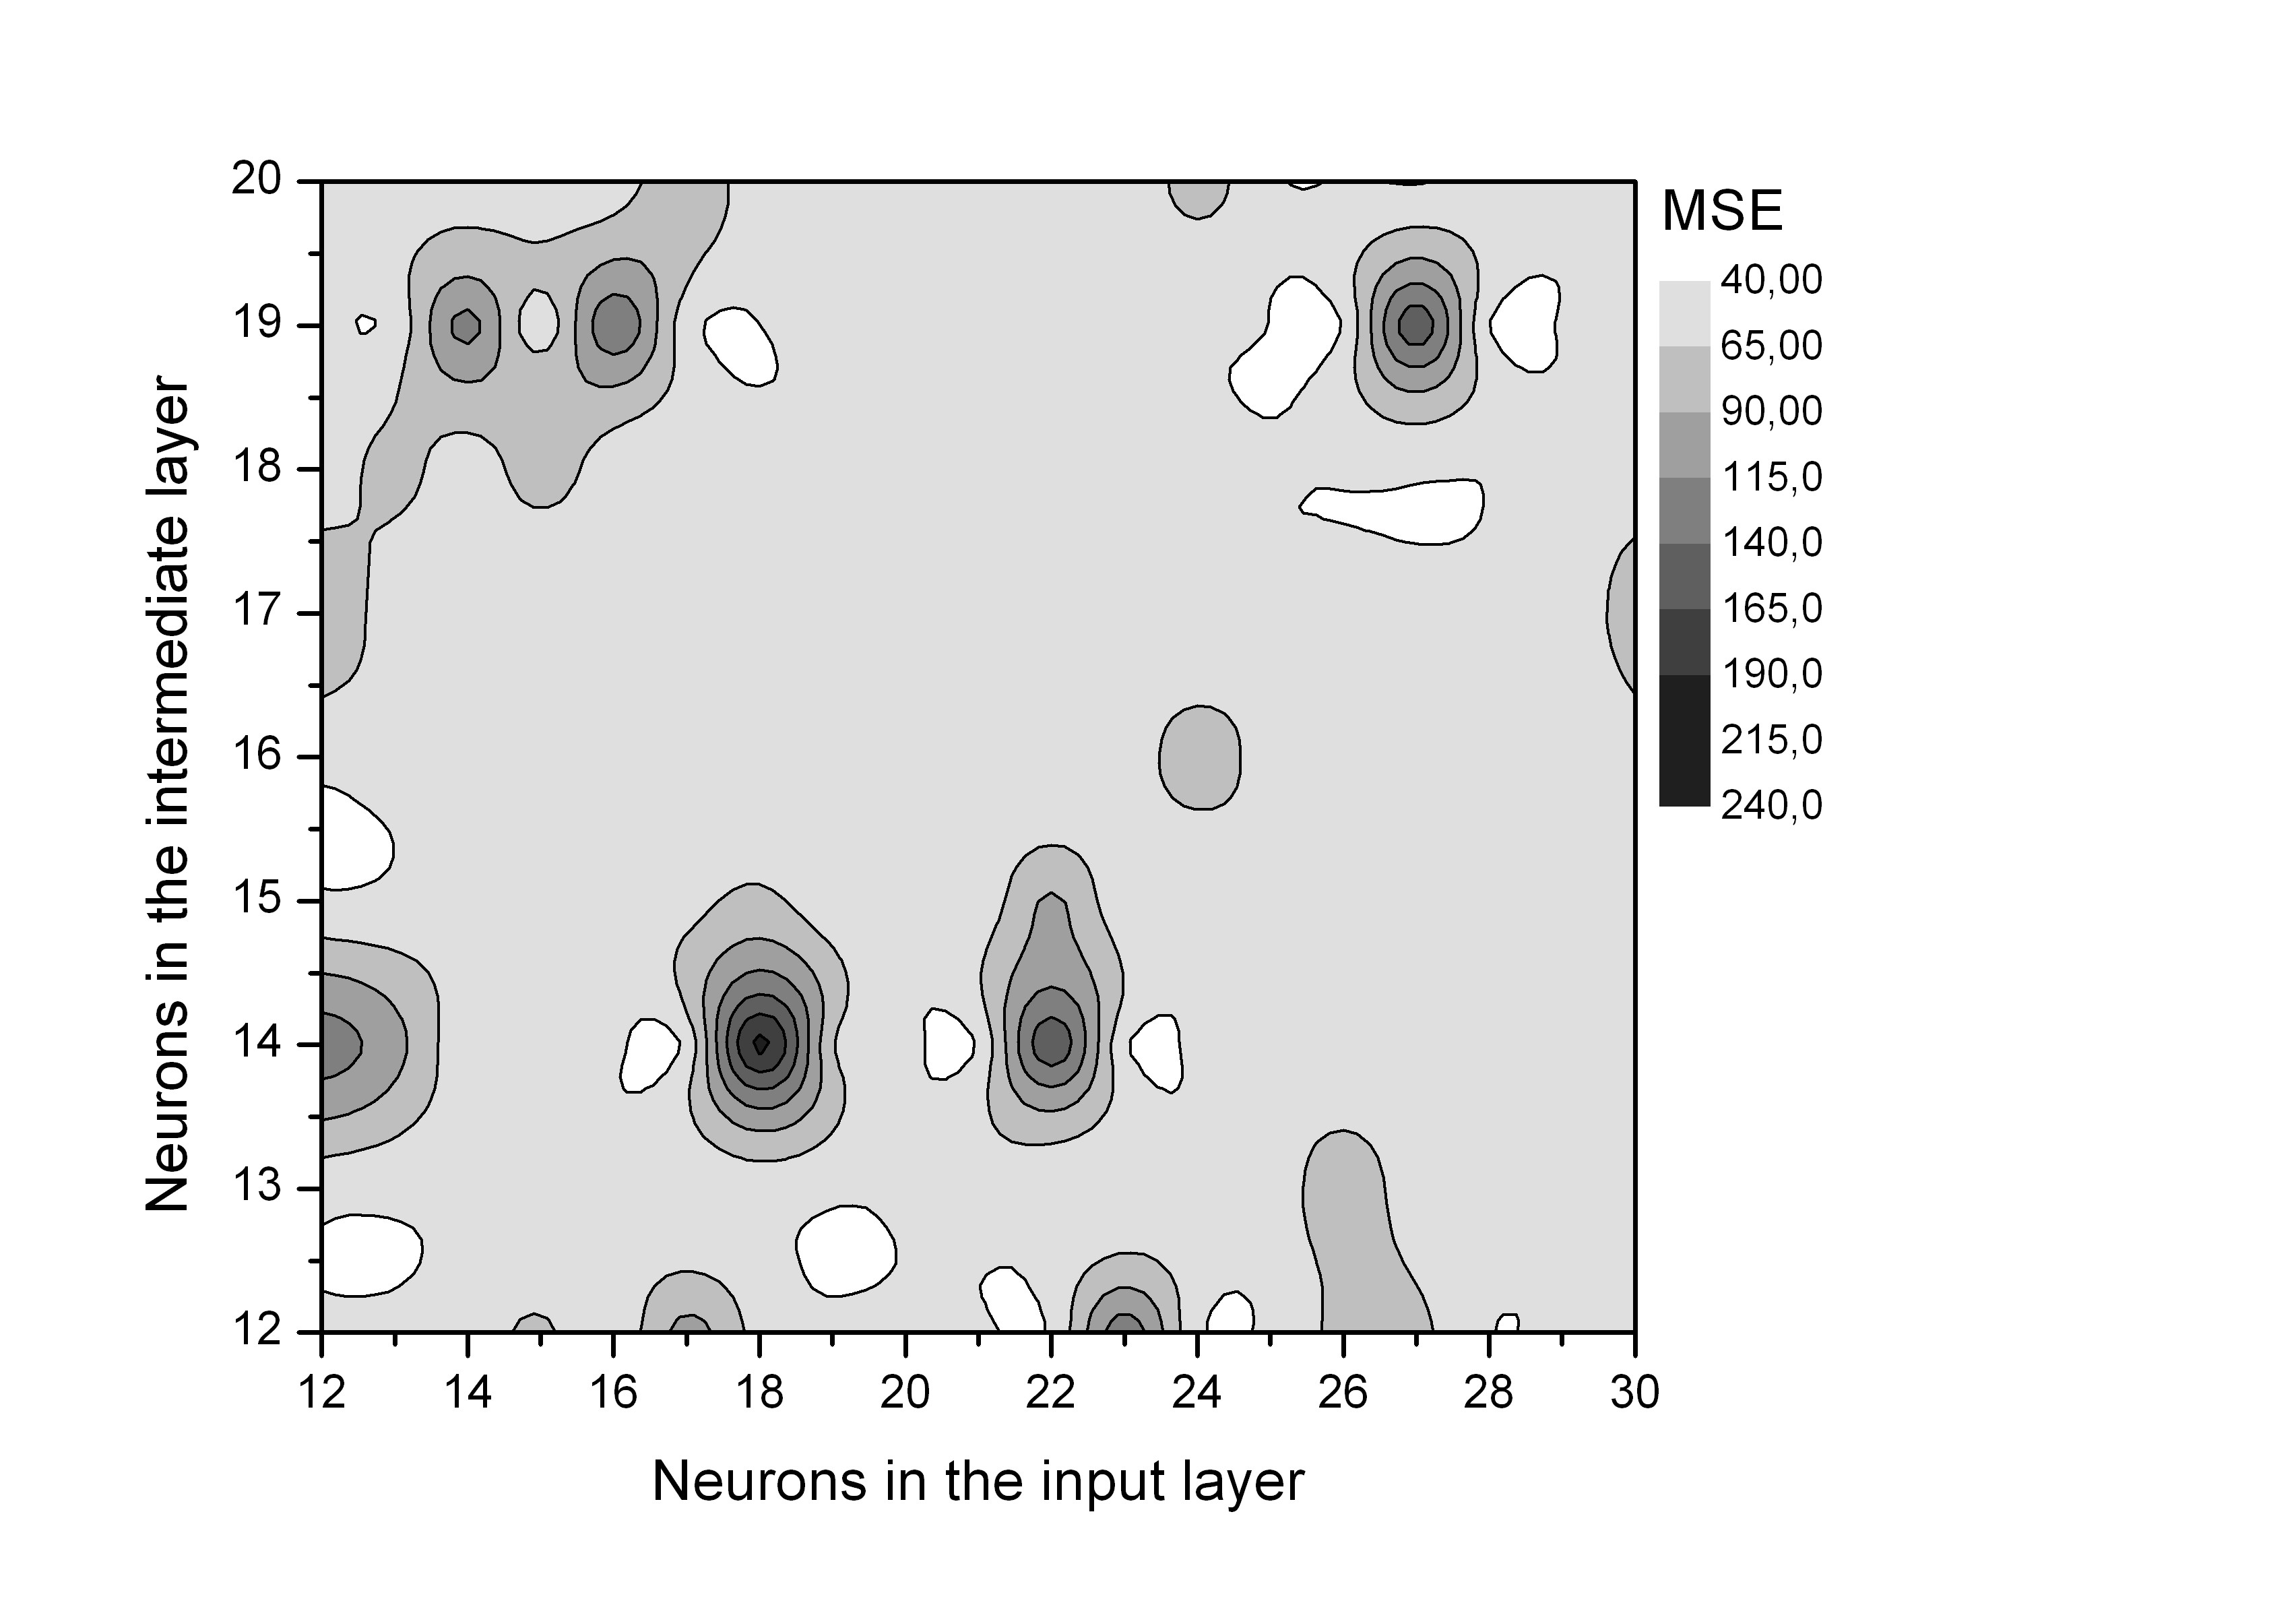
Table 3 shows the results for the synthesis of the flattening filter based on six FBGs
Table 4 and Fig. 6 show the measured MSE for the flattening gain filter based on six FBGs and the conventional technique. As can be seen, the approach based on six FBGs results in an improvement factor of 149.8, i.e. it represents a closer approximation to the target gain of 26 dB as compared to the results given by the system based on three FBGs. This behavior is observed in Fig. 6; notice that from 195.2 and 196.2 THz the obtained gain is equalized.
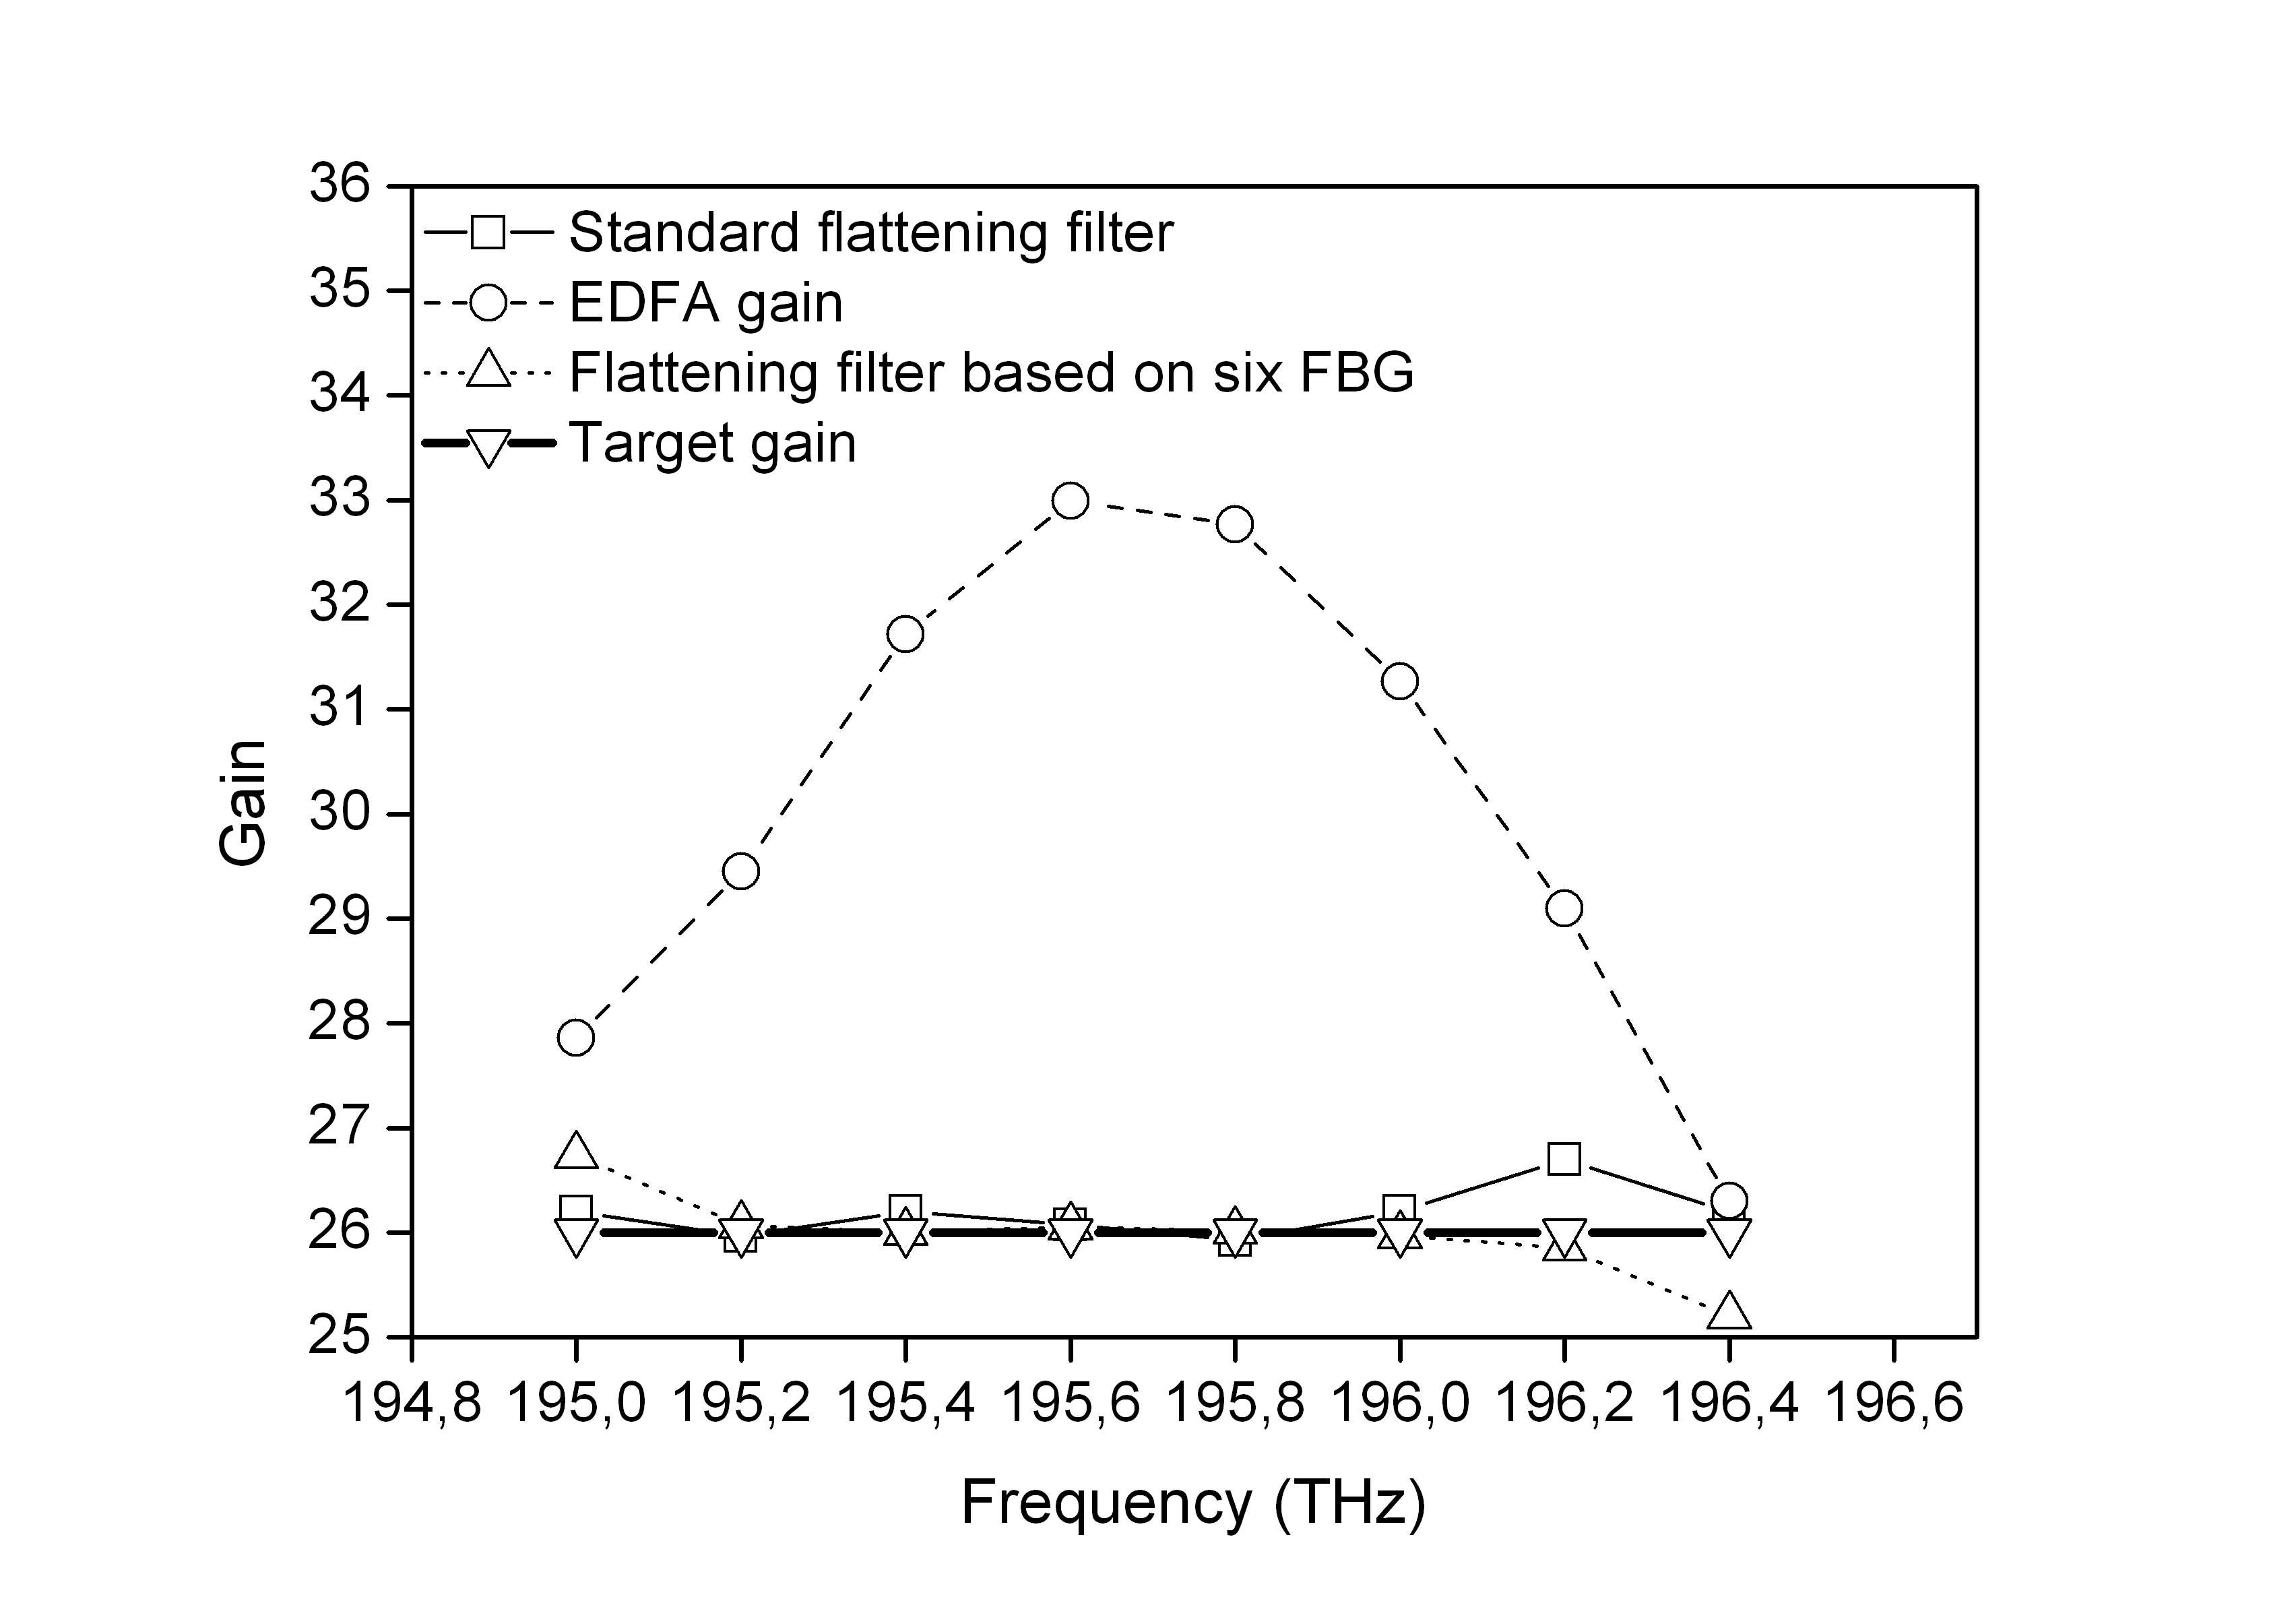
Fig. 6. Gain as function of frequency for a system without equalization (dashed line), with a standard flattening filter (thin solid line), flattening filter based on six FBGs (dotted line), and the target gain at 26 dB (bold continuous trace).
Table 3. Characteristics found for the flattening filter based on three FBGs
|
FBG 1 |
FBG 2 |
FBG 3 |
|||
|---|---|---|---|---|---|
| Frequency (THz) | Length (mm) | Frequency (THz) | Length (mm) | Frequency (THz) | Length (mm) |
|
195.2 |
3.55 |
195.4 |
5.31 |
195.6 |
6.1 |
|
FBG 4 |
FBG 5 |
FBG 6 |
|||
| Frequency (THz) | Length (mm) | Frequency (THz) | Length (mm) | Frequency (THz) | Length (mm) |
|
195.8 |
5.98 |
196 |
4.98 |
196.1855 |
28.4 |
Table 4. Mean square error for the flattening filter based on three FBGs
|
Mean Square Error (MSE) |
Improvement factor * |
|
|---|---|---|
|
Without equalization |
90,0660639 |
|
|
Flattening filter based on six FBGs |
0,600990184 |
149,862787 |
|
Standard flattening filter |
0,33108696 |
272,031 |
*With respect to the EDFA gain without equalization
The results summarized in Table 2 and Table 4 show that a MSE lower than that provided by the standard flattening filter was not achieved by the system based on FBGs, as it performed an improvement factor of 14.6 times better when compared to the system based on three FBGs and just 1.8 times better than the flattening filter based on six FBGs.
In order to evaluate the impact of having a flattening filter, the quality of signal based on the bit error rate (BER) and q factor measurement was performed over the eight optical carriers. The transported signals per carrier consisted of a 10 Gbps NRZ encoded and an optical power of 0 dBm. The link consisted of a standard single mode fiber spam of 100 km. Table 5 shows the signal quality found for the flattening filter based on three and six FBGs respectively. The table contrasts the results for the quality obtained with a standard flattening filter.
As seen, both the Q factor and BER are degraded in the system based on three FBGs. It means that the filtering response featured by only three FBGs, as shown in Fig. 6, is not suitable to assure a flat gain over the spectra used by the eight optical carriers. In contrast, the quality of signal found with the system based on six FBGs is similar to that presented by the standard flattening filter. It means that, while the equalization system based on FBGs approaches the results provided by the conventional system used to equalize the optical power, it requires less components to perform with the same quality features.
Table 5. Quality of signal obtained with a standard flattening filter and a flattening filter based on three and six FBGs
|
Standard Flattening filter |
Flattening filter based on three FBGs |
Flattening filter based on six FBGs |
||||
|---|---|---|---|---|---|---|
|
Optical Carrier |
Max. Q factor |
Min. BER |
Max. Q factor |
Min. BER |
Max. Q factor |
Min. BER |
|
1 |
5.0214 |
1.46E-07 |
4.58821 |
2E-07 |
4.99689 |
2.66E-07 |
|
2 |
5.1896 |
9.67E-08 |
3.64688 |
1.1E-4 |
4.99905 |
2.58E-07 |
|
3 |
5.1181 |
1.40E-08 |
2.43565 |
0.00602 |
5.28165 |
5.71E-08 |
|
4 |
5.18463 |
1.00E-07 |
2.09904 |
0.01624 |
5.52437 |
1.49E-08 |
|
5 |
5.24348 |
7.24E-08 |
2.24906 |
0.01131 |
5.05341 |
1.91E-07 |
|
6 |
5.13529 |
1.30E-07 |
3.57134 |
1.5E-4 |
5.20661 |
8.80E-08 |
|
7 |
5.2487 |
7.03E-08 |
4.04514 |
2.2E-05 |
3.26225 |
0.49E-6 |
|
8 |
5.11445 |
1.46E-07 |
4.54719 |
2.4E-07 |
4.79797 |
7.23E-07 |
Conclusion
This paper demonstrated the use of artificial neural networks in order to synthesize the filtering profile of a Fiber Bragg Grating array with a fewer number of resonances compared to the number of transmitted channels. The proposal aims at equalizing the gain of an Erbium Doped Fiber Amplifier for a flattened amplification of a Wavelength Division Multiplexed signal. We found a 7-10-6 structure for the artificial neural network that demonstrated the feasibility of equalizing the gain of an EDFA using as few as three FBGs. Improved results were obtained when the configuration consisted of an FBG array of six resonances derived from an artificial neural network with a 25-18-12 structure. While the system based on three FBGs featured an improvement factor of 18.51 compared to the system without equalization, an improved factor of roughly 149 was achieved with the system based on six FBGs. It is worth to point out that the per-carrier treatment of the standard flattening filter makes it perform better than the approach based on FBGs in terms of MSE measurement. However, this fact is barely appreciated in the quality of signal measurement as the approach based on six FBGs provided similar results to that featured by the standard gain-flattening filter for eight optical carriers. Thus, the use of artificial neural networks enables the synthesis of a flattening filter based on FBGs with a reduced number of optical devices. In this work, we demonstrated that six FBGs equalize the EDFA gain for a WDM comb of eight channels keeping a similar performance provided by a standard flattening filter that requires a dedicated filter resonance per optical channel.

