


 text in
  English (pdf)
 Article in xml format
 Article references
 Send this article by e-mail
 Cited by SciELO
  Cited by Google
  Similars in
SciELO
Similars in
SciELO  Similars in Google
 Permalink
Remark
| 1) Why was this study conducted? |
| The impact of coexisting maternal multiple infections, nutrient deficiencies and inflammation on placental and newborn outcomes has not been studied in indigenous communities. |
| 2) What were the most relevant results of the study? |
| Maternal subclinical malnutrition, expressed as low maternal and cord hemoconcentration and as micronutrient deficiencies, was associated with lower placental weight and lower infant anthropometric measurements. Maternal inflammation indicators were associated with lower infant length and head circumference. |
| 3) What do these results contribute? |
| We report data on maternal, placental and neonatal measurements as well as data on inflammation and nutritional biomarkers in maternal and cord blood from indigenous mother-infant dyads living in a remote community in Panama. Our findings unveiled subclinical maternal inflammation and maternal and neonatal under-nutrition that require public health interventions. |
Introduction
Indigenous communities in the Americas constitute vulnerable minorities with higher health disadvantages 1,2. Indigenous pregnant women are at higher risk of delivering low birthweight babies, maternal and infant mortality, and children have higher rates of malnutrition and lower life expectancy 3. Native peoples from North America have high rates of preterm delivery and infant mortality 4,5 but not small for gestational age 4. The higher prevalence of these complications is often associated with the remoteness of most indigenous communities 6.
The study of placental outcomes in indigenous populations is rare. A study that compared placental specimens from indigenous and non-indigenous low-risk women delivering at term showed that placental inflammation was more frequent in indigenous women 7. Also, placental malarial infection was a risk factor for low birthweight of infants from indigenous mothers 8. To our knowledge, no studies of placental outcomes in Latin American indigenous women have been performed.
Nutritional status is also known to differ in indigenous mothers and infants compared with non-indigenous communities. In Canada, energy malnutrition is not a problem, but micronutrient deficiencies, particularly iron, vitamins A, D, folic acid and fluoride, as well as the presence of infections are problematic 9. Both mothers 10 and newborns 10,11) from native communities in Northern Canada have lower vitamin A concentrations than non-native populations.
Indigenous Latin American communities are even more disadvantaged, given the conditions of remoteness, and also extreme poverty, lack of water/sanitation, access to health and education systems and lower intake of quality foods during critical periods of growth and development 12. National surveys in Mesoamerican countries that included indigenous communities have reported elevated rates of anemia and wasting [weight-for-height Z-scores <-2 standard deviations (SD)] in early childhood 13.
Although traditional indigenous foods are known to be good sources of micronutrients including iron and vitamin D, food insecurity and dietary transitions have resulted in increased malnutrition in indigenous communities 14. Iron 15, vitamin A 16) and vitamin D deficiencies 17,18) have been found to be prevalent in indigenous communities. This is of particular interest given the recognized link between maternal iron deficiency and adverse outcomes of pregnancy (19,20 and between micronutrient deficiencies during pregnancy and longer-term impacts into adulthood 21.
Despite evidence that micronutrient deficiencies in women of reproductive age are major health problems 22, factors associated with adverse pregnancy outcomes in indigenous communities are less understood. We had previously reported that pregnant and lactating women from the Ngäbe-Buglé indigenous community, the largest and fastest growing indigenous community in Panama, had multiple coexisting infections 23, multiple nutrient deficiencies and inflammation 24, and that maternal low pulse pressure was associated with smaller fetuses using symphysis-fundal height as indicator 25. For this cross-sectional exploratory study, our overarching goal was to assess the inflammation and nutritional status of mother-infant dyads, including deficiencies in iron, vitamin D and vitamin A, as well as their associations with placental and newborn anthropometry, the two pregnancy outcomes available at delivery in women from the Ngäbe-Buglé Comarca.
Materials and Methods
Ethics approval was obtained from the Gorgas Memorial Institute in Panama (No. 1618/CNBI/ICGES/10) which required, as a prerequisite for final approval, a signed agreement with indigenous authorities of the Ngäbe-Buglé comarca and with the Panamanian Ministry of Health. Ethics approval was also obtained from McGill University in Canada (No. A03-M25-08B). All were in accordance with the recommendations of the Operational Guides of Bioethics in Research. Participants gave written informed consent in accordance with the Declaration of Helsinki 26.
Context and participants
The ‘Hospital General del Oriente Chiricano’ in San Félix, Panama, serves mainly indigenous peoples, in whom professional attendance of delivery occurred only in 43.9% in 2010 27, the remainder were home deliveries attended by traditional midwives. In an effort to increase institutional delivery attendance for indigenous women living in remote areas, Comarcal Health Authorities partnered with the Catholic church and arranged a temporary home in San Felix, near the local hospital where women at the end of their pregnancies could stay for several weeks with a companion, while waiting for delivery. They received health education and nurse follow-up. These indigenous women and those living close-by the town of San Felix, reached the local hospital for normal vaginal delivery. The hospital reported 620 deliveries in 2010 27) and we were able to recruit 34 women at delivery in our one-month screening period between November and December 2010 (65% of expected deliveries/month). Complicated pregnancies including those requiring caesarean section were referred to the nearest second-level hospital, one hour away by car from San Felix. Those women were not included in the study.
Indigenous pregnant women in normal active normal labor admitted to the Obstetric Unit were asked to participate, only if they were having spaced contractions, were willing to chat and feeling well enough to receive an explanation of the project and to provide informed consent. Information from hospital files including obstetric history, and vital signs and anthropometrics at admission were recorded.
Clinical indicators
Blood pressure was taken when mothers were admitted to the labour room, in supine position, in between uterine contractions using a mercury sphygmomanometer. Pulse pressure was calculated by subtracting diastolic blood pressure from systolic blood pressure 28, and pulse pressure <42 mmHg was considered low 29. Mean arterial pressure [Mean arterial pressure = (systolic blood pressure + 2x diastolic blood pressure)/3] was calculated (28, and mean arterial pressure >86 mm Hg was identified as high 30.
Maternal blood samples were routinely collected at admission, and an extra 10 mL was collected for serum micronutrient analyses. Deliveries were attended by a local physician assisted by 1-2 nurses. Infant Apgar scores at 1 and 5 minutes and macroscopic characteristics of amniotic fluid at birth observing the presence of meconium were recorded. Delayed cord clamping was part of the institutional protocol. Cord blood samples were taken immediately after cord blood clapping and before placental delivery.
Biometric measurements
Placenta: Placental weight was measured using an electronic balance and its diameter using a non-extensible measuring tape. Macroscopic characteristics of placentae including the visual presence of nodules classified as small (pinpoint type) or large (plaques of ≥5 mm diameter) were recorded. Placental weight Z-scores for fetal weight were calculated using standards derived from 20,635 singleton deliveries registered at the McGill Obstetrics and Neonatal Database 31.
Infant Anthropometry: Nurses of the obstetric department at San Félix hospital took routine anthropometry measurements (weight, length and head circumference) of infants immediately after delivery. Measurements registered in clinical files were used to calculate Z-scores of weight-for-age, Z-scores of length-for-age, Z-scores of weight-for-length, and Z-scores of head circumference-for-age based on INTERGROWTH-21 standards 32.
Complete blood cell counts
Maternal and cord blood were analyzed for complete blood cell count using a BC-5500 Mindary Auto Hematology Analyzer. Maternal anemia was defined as hemoglobin (Hb) <11 g/dL 33. Specific cut-offs for the third trimester of pregnancy were used for other red blood cell (RBC) indices 34. Platelet indices with no established cut-offs for pregnancy [plateletcrit and platelet distribution width] were compared against normal population values 35. We used newborn blood cell count cut-offs by sex and gestational age at delivery as described by Glasser et al36. Newborn anemia was defined as cord hemoglobin <116 g/L in girls and <120 g/L in boys 36. Normal cord blood ranges for plateletcrit and platelet distribution width were taken from the study by Basu et al37.
Serum analyses
Serum from maternal and cord blood was frozen at -20o C before processing at the Gorgas Memorial Institute in Panama City for ferritin enzyme immunoassay (ELISA, MP Biomedicals, Orangeburg, NY) with a minimum detectable concentration of 5 ng/mL, for Ramco’s serum transferrin receptor (sTfR) enzyme immunoassay based upon the double antibody sandwich method with a lower limit value of 1 µg/L, and for a high sensitivity enzyme immunoassay of C-reactive protein, based on the principle of a solid phase ELISA, with a minimum detectable concentration of 0.1 mg/L (MP Biomedicals, Orangeburg, NY). Maternal iron deficiency was defined as sTfR >8.3 mg/L (Ramco®) or serum ferritin <20 µg/L (as defined by WHO at the time of the study) 33, and newborn iron deficiency as cord sTfR >9.6 mg/L or cord ferritin <114 µg/L 38. C-reactive protein was considered elevated if >8.1 mg/L in maternal serum 34, or >0.5 mg/L in cord blood 39.
Vitamin A concentrations were determined using high-performance liquid chromatographic technique (HPLC) at the Institute of Scientific Research and High Technology Services INDICASAT in Panama City. Remaining serum samples were transported to Montreal for further processing using LIAISON for 25 OH vitamin D at the School of Human Nutrition of McGill University. Maternal and neonatal vitamin A were considered as deficient if <0.35 μmol/L, or insufficient if <1.05 μmol/L 11,40,41. Both maternal and neonatal 25(OH)D were considered low if <50 nmol/L 42,43.
To explore the possibility of maternal hypovolemia suggested by previous research in this population 25, calculations of maternal and neonatal total blood volume were made using Nadler’s formula (total blood volume =0.3561 x (Height in meters)3 + 0.03308 x Weight in kgs + 0.1833 44,45. The mean ± SD (82.28 ± 16.9 mL/kg) of blood volume found in term neonates calculated by pulse dye densitometry with indocyanine green 46) was considered normal. Maternal plasma volume was calculated as total blood volume x (1-hematocrit) 47. A low maternal plasma volume was considered if < 5th percentile for term-pregnancies (< 2.8 L) as defined by de Haas et al48.
Statistical analyses
Statistical analyses were performed using the SPSS software v.25.0 for Mac (SPSS Inc., Chicago, IL, USA) and Stata/IC 16.1 for Mac (TX, USA). Descriptive statistics were used to calculate means, medians, interquartile ranges (IQR) and proportions. Correlations between maternal and neonatal blood cell indices and serum biomarkers were assessed. A Student-T test was used to compare the number of cord eosinophils with the presence/absence of maternal eosinophilia, defined as >0.6 x10³/mm3 (33. A p-value <0.05 was considered statistically significant.
To evaluate associations of placental outcomes (weight and diameter), and of infant anthropometry [weight (kg), length (cm) and head circumference (cm) as well as Z-scores of weight-for-age, Z-scores of weight-for-length, Z-scores of length-for-age and Z-scores of head circumference-for-age], covariates were grouped into maternal characteristics (age, parity, gestational age, weight for height classification, blood pressure measurements and maternal plasma volume), and four sets of maternal/cord blood variables: inflammation indicators [C-reactive protein, white blood cells (WBC) and differential including the neutrophil/lymphocyte ratio (NLR)], RBC indices; platelet indices; and nutritional indicators (ferritin, sTfR, vitamins A and D). For newborn weight (kg) and length (cm) models, gestational age was also included. Each group of covariates was evaluated using bootstrap regressions with 1,000 repetitions, and those variables entering ≥ 50% repetitions were selected 49) and used in multivariable fractional polynomial regression models. The multivariable fractional polynomial algorithm combines backwards elimination and the determination of suitable functional forms from the fractional polynomial class to address possible nonlinearity 50. The significance level for removal from the model was set at 0.15, in order to achieve a maximum of 4 variables entering final models. Missing data (3 for maternal weight, 3 for maternal height, 1 for maternal C-reactive protein and 1 for infant’s length) were not imputed and complete case analyses were performed. To further explore the association between maternal neutrophils and birth length, the cut-point of neutrophils for the detection of Z-scores of weight-for-length <-2 was assessed using the Liu method, which maximizes the product of the sensitivity and specificity 51. Absence of collinearity and stability of regression coefficients were evaluated using a variance inflation factor <10 and a condition number <30 respectively.
Results
Study participants
Characteristics of mothers, placentae and newborns are shown in Table 1. Among known risk factors for adverse outcomes, our sample included maternal adolescence (35.3%), grand multiparity (29.4%), elevated mean-arterial pressure (55.9%) and low pulse pressure (82.3%). All women had term-deliveries with gestational age ranging from 37-42 weeks. Placentae were <10th centile-for gestational age in 35.3%; amnion nodular lesions were observed in 70.6% of placentae, 41.2% being pinpoint shaped and 29.4% being larger plaques.
Table 1 Maternal, placental and newborn characteristics
| Maternal Characteristics | Placental characteristics | ||
|---|---|---|---|
| Age (years), median (min-max) | 23 (16-37) | Weight (gr), mean ± SD | 565.6 ±113.8 |
| ≤19 yr, n (%) | 12 (35.3%) | Diameter (cm), mean ± SD | 20.1 ±2.2 |
| ≥35 yr, n (%) | 3 (8.8%) | Placental weight <10th centile for gestational age, n (%) | 12 (35.3%) |
| Number of deliveries, median (min-max) | 3 (1-10) | Presence of amnion nodules, n (%) | 24 (70.6%) |
| 1st, n (%) | 5 (14.7%) | Amniotic fluid at delivery | |
| ≥ 5, n (%) | 10 (29.4%) | Clear, n (%) | 23 (67.6%) |
| Pre-delivery vital signs | Diluted meconium, n (%) | 7 (20.6%) | |
| Temperature (oC), mean ± SD | 37.0 ±0.4 | Thick meconium, n (%) | 4 (11.8%) |
| Cardiac rate, bpm, mean ± SD | 79 ±6 | Newborn characteristics | |
| Blood pressure (BP), mmHg | Male, n (%) | 21 (61.8%) | |
| Systolic BP, mean ± SD | 108 ±12 | Female, n (%) | 13 (38.2%) |
| Diastolic BP, mean ± SD | 73 ±8 | Gestational age, weeks, mean ± SD | 39.4 ± 1.16 |
| Pulse Pressure, mean ± SD | 35 ±10 | Birth weight (kg), mean ± SD | 3.3 ±0.43 |
| Pulse Pressure < 42 mmHg, n (%) | 28 (82.3%) | Birth length (cm), mean ± SD (n=33) | 51.02 ±1.5 |
| Mean Arterial Pressure, mean ± SD | 85 ±9 | Head circumference (cm), mean ± SD | 33.3 ±1.6 |
| Mean arterial pressure >86 mmHg, n (%) | 19 (55.9%) | Weight for age z score, mean ± SD | 0.09 ±1.0 |
| Anthropometrics | Z-scores of weight-for-age <-2 SD, n (%) | 1 (2.9%) | |
| Weight (kg), mean ± SD (n=31) | 62.8 ±8.9 | Weight for length z score, mean ± SD | -0.3 ±1.1 |
| Height (m), mean ± SD (n=31) | 1.49 ±0.05 | Z-scores of weight-for-length <-2 SD, n (%) | 2 (6.0%) |
| Weight for height for gestational age (n=29) | Length for age z score, mean ± SD | 1.0 ±0.9 | |
| Underweight, n (%) | 5 (16.1%) | Z-scores of length-for-age <-2 SD, n | 0 |
| Normal Weight, n (%) | 18 (58.1%) | Head circumference for age z score, mean ±SD | -0.47 ±1.3 |
| Overweight, n (%) | 8 (25.8%) | Z-scores of head circumference-for-age < -2 SD, n (%) | 6 (17.6%) |
| Maternal plasma volume (L), mean ± SD | 2.18 ±0.26 | Infant total blood volume (L/k), mean ± SD | 0.34 ±0.02 |
Data reported correspond to 34 mother-infant dyads unless otherwise specified
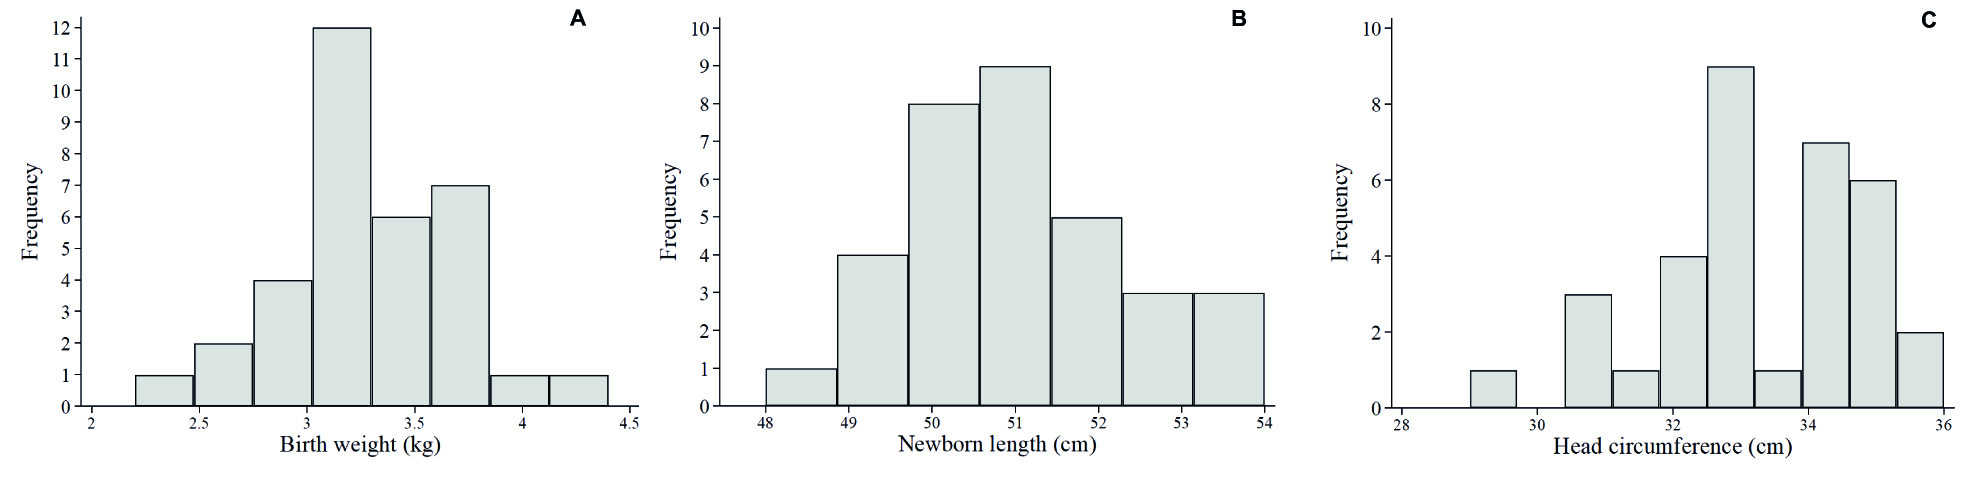
The distributions of newborn weight, length and head circumference are shown in Figure 1. Low birthweight was not observed, low Z-scores of weight-for-age, Z-scores of weight-for-length and Z-scores of length-for-age each had prevalences ≤6%, but Z-scores of head circumference-for-age <-2 was found in 17.6% of the sample (Table 1).
Complete blood cell counts and serum biomarkers
Complete blood cell counts are shown in Table 2, and a comparison of serum analyses of maternal and cord blood indices in Table 3. Of note, no significant correlations were found between maternal blood and their correspondent cord for blood cells or serum biomarkers, except for maternal and cord vitamin D, which had a positive correlation (r2= 0.79, p <0.0001).
Table 2 Complete blood cell counts in maternal and cord blood
| Maternal blood | Cord blood | |
|---|---|---|
| RBC indices | ||
| RBC x106 | 3.94 (3.65-4.20) | 3.68 (3.42-3.84) |
| Hemoglobin (g/L) | 119 (110-142) | 132 (126-141) |
| Anemia a, n (%) | 8 (23.5%) | 2 (5.9%) |
| Hematocrit (%) | 36.55 ( 34.70-38.70) | 41.90 (349.00-45.10) |
| Low hematocrit b, n (%) | 1 (2.9%) | 5 (14.7%) |
| High hematocrit, a n (%) | 6 (17.6%) | 5 (14.7%) |
| MCV (fL) | 93.00 (89.10-97.90) | 114.00 (111.00-117.00) |
| Microcytosis c, n (%) | 2 (5.9%) | 5 (14.7%) |
| Macrocytosis c, n (%) | 4 (11.8%) | 5 (14.7%) |
| mean corpuscular hemoglobin (pg/L) | 30.30 (28.80 ± 31.90) | 35.85 (35.20-36.80) |
| Low mean corpuscular hemoglobin d | 9 (26.5%) | 7 (20.6%) |
| mean corpuscular hemoglobin concentration (g/L) | 326 (316-332) | 315 (310-322) |
| Low mean corpuscular hemoglobin concentration e | 11 (32.3%) | 0 |
| RDW-CV | 13.15 (12.40-13.70) | 15.25 (14.70-15.50) |
| Elevated RDW-CV f | 2 (5.9%) | 0 |
| RDW-SD | 45.35 (43.60-48.00) | 63.30 (62.20-66.60) |
| Elevated RDW-SD g | 15 (44.1%) | 0 |
| WBC and differential | ||
| Total WBC x103/mm3 | 11.53 (10.10-14.30) | 11.09 (9.62-13.02) |
| Elevated WBC h, n (%) | 3 (8.8%) | 0 |
| Neutrophils | 8.75 (7.40-11.06) | 6.14 (5.15-6.98) |
| Elevated neutrophils i, n (%) | 2 (5.8%) | 1 (2.9%) |
| Lymphocytes j | 1.98 (1.37-2.58) | 3.93 (2.98-4.42) |
| Monocytes k | 0.46 (0.33-0.55) | 1.00 (0.84-1.13) |
| Eosinophils | 0.13 (0.07 - 0.21) | 0.07 (0.05-0.09) |
| Elevated eosinophils l | 26 (76.5%) | 0 |
| Basophils m | 0.03 (0.02-0.05) | 0.08 (0.05-0.10) |
| Platelet indices | ||
| Platelets x106/mm3 n | 0.24 (0.20-0.27) | 0.20 (0.19-0.24) |
| mean platelet volume (fL) | 8.90 (8.00-10.20) | 7.70 (7.40-8.10) |
| Low mean platelet volume o | 9 (26.5%) | 29 (85.3%) |
| High mean platelet volume o | 6 (17.6%) | 0 |
| Plateletcrit (%) | 21.95 (18.50-23.90) | 16.30 (13.80-19.00) |
| Low plateletcrit p | 17 (50%) | 21 (61.8%) |
| High plateletcrit p | 8 (23.5%) | 0 |
| platelet distribution width q | 16.20 (15.90-16.60) | 16.80 (16.50-17.10) |
Mean ± SD for normally distributed variables and median (IQR) for not-normally distributed variables are reported. Maternal normal values according to Abbassi-Ghanavati et al 33, and cord blood normal values according to Glasser et al 37 unless otherwise specified.
a Normal hemoglobin: mothers, ≥ 110 g/L 43; cord blood, ≥116 g/L (girls) and ≥ 120 (boys)
b Normal hematocrit: mothers, ≥28 and ≤40%; cord blood, ≥37.2% and ≤46.4%
c Normal MCV: mothers, ≥82.4 fL and ≤ 100.4 fL; cord blood, ≥99 fL (gils) and ≥98 fL (boys), ≤120 fL (girls) and ≤119 fL (boys)
d Low mean corpuscular hemoglobin: mothers, <29 pg; cord blood, <31.1 (girls) and <31.0 (boys)
e Low mean corpuscular hemoglobin concentration: mothers, <31.9 g/dL; cord blood, <28.9 g/dL (girls) and <29.1 g/dL (boys)
f Elevated RDW-CV: mothers, >16.6%; cord blood, >19.5%
g Elevated RDW-SD: mothers, >46 fL; cord blood, >82 fL (girls) and >81 fL (boys)
h Elevated WBC: mothers, >16.9 x10³/mm3; cord blood, >24.15 (gilrs) and >22.9 (boys)
i Elevated neutrophils: mothers, >13.1 x10³/mm3; cord blood, >14.90 x10³/mm3 (girls) and >13.5 x10³/mm3 (boys)
j Elevated lymphocytes: mothers, >3.6 x10³/mm3; cord blood, >7.36 x10³/mm3 (girls) and >7.42 x10³/mm3 (boys)
k Elevated monocytes: mothers, >1.4 x10³/mm3; cord blood, >2.91 x10³/mm3 (girls) and >2.88 x10³/mm3 (boys)
l Elevated Eosinophils: mothers, >0.6 x10³/mm3; cord blood >1.00 x10³/mm3 (girls) and >1.20 x10³/mm3 (boys)
m Elevated basophils: mothers, >0.1 x10³/mm3; cord blood >0.24 x10³/mm3 (girls) and >0.28 x10³/mm3 (boys)
n Normal platelet count: mothers, 146-429 x103/mm3; cord blood, 84-288 x103/mm3 (girls) and 88-280 x103/mm3 (boys)
o Normal mean platelet volume: mothers, 8.2-10.4 fL; cord blood, 8.5-11.1 fL (girls) and 8.4 - 11.0 fL (boys)
p Normal plateletcrit: mothers: 0.22-0.24% 36, cord blood, 0.18 - 0.34% 38.
q Normal platelet distribution width: mothers: 8.3-56.6% 36; cord blood, 14.8 - 17.6% 38
Table 3 Serum biomarkers in maternal and cord blood
| Maternal serum Median (IQR) n (%) | Cord blood Median (IQR) n (%) | |
|---|---|---|
| C-reactive protein, mg/L | 15.5 (11.4-18.9) | 0.10 (0.1-0.1) |
| Elevated C-reactive protein1 | 29 (85.3%) | 0 |
| Ferritin, µg/L | 19.1 (8.4-40.6) | 101.9 (59.1-121.4) |
| Low ferritin2 | 18 (52.9%) | 24 (70.6%) |
| sTfR, mg/L | 3.3 (1.8-5.1) | 6.0 (5.2-10.2) |
| Elevated sTfR3 | 5 (14.7%) | 10 (29.4%) |
| Iron deficiency (low ferritin or elevated sTfR) | 20 (50.8%) | 27 (79.4%) |
| Vitamin D, nmol/L | 57.6 (48.7-74.7) | 37.8 (26.0-45.5) |
| Low vitamin D4 | 10 (29.4%) | 28 (82.3%) |
| Vitamin A, µmol/L | 1.04 (0.8-1.4) | 0.44 (0.38-0.51) |
| Low vitamin A5 | 17 (50%) | 34 (100%) |
Median (interquartile range - IQR) and n (%) for frequencies are reported.
1 Elevated C-reactive protein: maternal, >8.1 mg/L 33; cord, >0.5 mg/L 34.
2 Low ferritin: maternal, <20 µg/L 35; cord, <114 µg/L 43.
3 Elevated sTfR: maternal: >8.3 mg/L (Ramco® laboratories) ; cord, >9.6 mg/L 43.
4 Low vitamin D: maternal and cord, <50 nmol/L 39,40.
In mothers, anemia (23.5%), low erythrocyte hemoglobin [low mean corpuscular hemoglobin in 26.5% and low mean corpuscular hemoglobin concentration in 32.3%] and elevated red cell deviation width (RDW-SD, 44.1%) were observed, however most women had normocytic RBCs (82.3%). In contrast, only one woman had low hematocrit, and hematocrit was high in 17.6% (Table 2), suggesting the presence of hemoconcentration. The calculation of maternal plasma volume indicated that all women but one had plasma volume below 2.8 L, the 5th centile for gestational age. Despite maternal anemia, cord RBC indices appeared normal in most cases, with only two presenting anemia, and all newborns had blood volume within normal ranges (84.8 ± 0.7 mL/kg). However, low cord mean corpuscular hemoglobin (20.6%) and the presence of both low (14.7%) and elevated hematocrit (14.7%) indicated that hemoconcentration may have also been present in cord blood. Of note, a low cord mean platelet volume was present in most infants (Table 2).
Iron deficiency indicated by low ferritin or elevated sTfR was present in 50.8% of mothers and in 79.4% of infants (Table 3). Vitamin D deficiency was present in 29.4% of mothers and 82.3% of newborns, and half of the women had vitamin A deficiency, whereas all infants had vitamin A <1.05 nmol/L.
Regarding inflammation, it was noticeable that among WBCs, only eosinophils were elevated in most women (76.5%). Although maternal and cord blood eosinophils were not significantly correlated (rs= 0.29, p= 0.085), cord eosinophils were significantly higher in newborns from women with eosinophilia [median 0.09, IQR (0.05-0.11)] than in newborns from women with normal eosinophil count [0.05 (0.04-0.06)]. Moreover, most women had elevated C-reactive protein using the conservative cut-offs for the third trimester of pregnancy (85.3% >8.1 mg/L) (Table 3), but cord C-reactive protein was not elevated (Table 3).
Multivariable fractional polynomial regression models for placental outcomes
Multivariable fractional polynomial regression models for placental weight and diameter are described in Table 4. Placental weight was positively associated with maternal plasma volume (Table 4A, Figure 2A). Larger placental diameter was associated with higher cord eosinophil count (Table 4B, Figure 2B) and higher concentrations of cord vitamin D (Table 4B, Figure 2C).
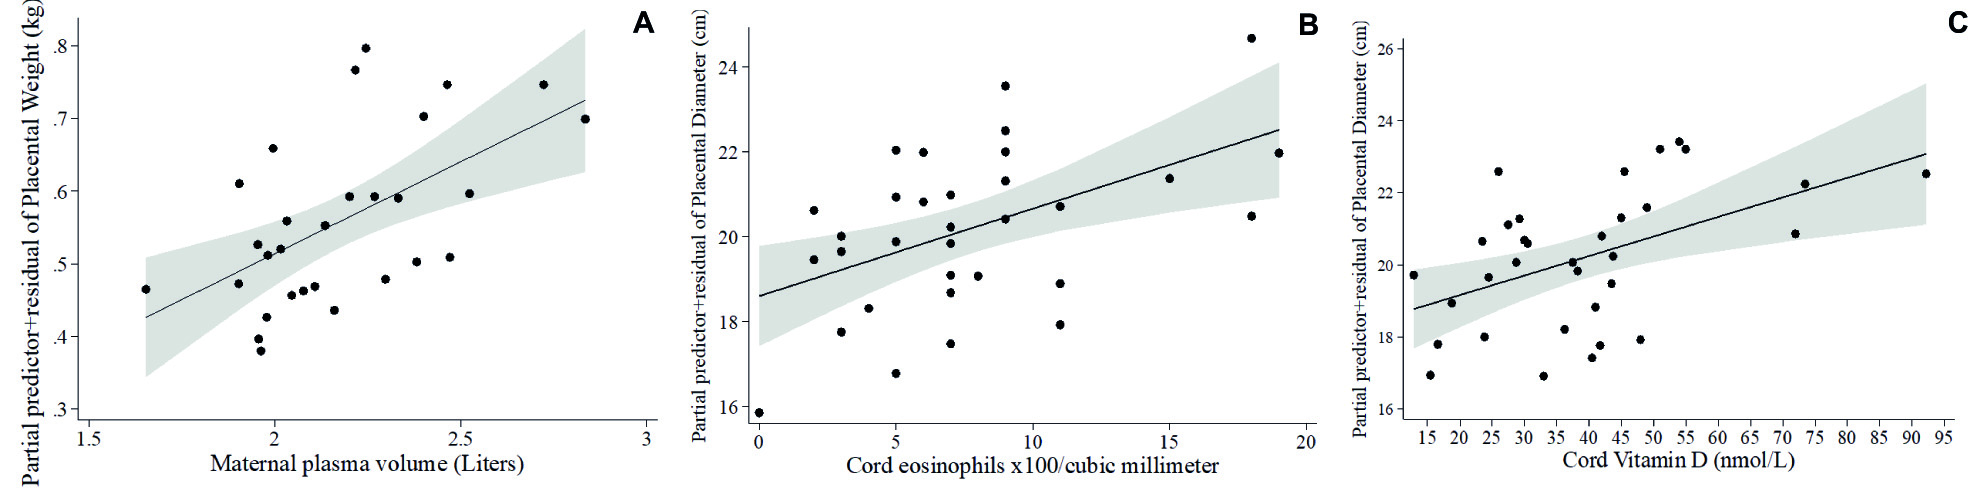
Figure 2 Fractional polynomial regression, adjusted for covariates, for associations of (A) placental weight and maternal plasma volume, (B) placental diameter and cord eosinophil count, and (C) placental diameter and cord vitamin D
Table 4 Multivariable fractional polynomial regression models of placental measurements.
| Coef. ±SE | p | 95% CI | β | Overall model | |
|---|---|---|---|---|---|
| A. Placental weight, kg | |||||
| t Gestational age, weeks | -0.006 ±0.01 | 0.700 | -0.03, 0.04 | 0.06 | Adj R2 = 0.325 p = 0.006 |
| t Maternal plasma volume, L | 0.25 ±0.07 | 0.002 | 0.10, 0.40 | 0.57 | |
| Constant | 0.56 ±0.02 | <0.0001 | 0.52, 0.60 | ||
| B. Placental diameter, cm | |||||
| t Gestational age, weeks | 0.24 ±0.26 | 0.372 | -0.30, 0.78 | 0.13 | Adj. R2 = 0.374 p = 0.0008 |
| t Cord eosinophils count x102/mm3* | 0.21 ±0.07 | 0.005 | 0.07, 0.34 | 0.43 | |
| t Cord vitamin D, nmol/L | 0.05 ±0.02 | 0.005 | 0.02, 0.09 | 0.43 | |
| Constant | 20.19 ±0.30 | <0.0001 | 19.58, 20.81 | ||
Placental weight: variance inflation factor =1.00, condition number=102, n=29. Variables that entered ≥500 bootstrap repetitions but that were taken out by the multivariable fractional polynomial process: maternal neutrophil/lymphocyte ratio, hemoglobin, hematocrit and ferritin, cord blood basophils, MCV, mean corpuscular hemoglobin concentration and vitamin D.
t = Transformed variable. Equations used by the multivariable fractional polynomial process for covariate transformations:
t gestational age (weeks) = gestational age - 39.4137931
t Maternal plasma volume (L) = Maternal plasma volume - 2.179750286
Placental diameter: variance inflation factor =1.02, condition number=1.17, n=33. Variables that entered ≥500 bootstrap repetitions but that were taken out by the multivariable fractional polynomial process: maternal platelet count, plateletcrit, hemoglobin, hematocrit, MCV, vitamin D and ferritin; cord blood hemoglobin, hematocrit, MCV, platelets and basophils.
t = Transformed variable. Equations used by the multivariable fractional polynomial process for covariate transformations:
t gestational age (weeks) = gestational age - 39.36363636
t Cord eosinophils count x103/mm3= Cord eosinophils - 7.757575786. *One influential observation was ommited.
t Cord vitamin D, nmol/L = Cord vitamin D - 39.06720609
Multivariable fractional polynomial regression models for newborn anthropometry measurements
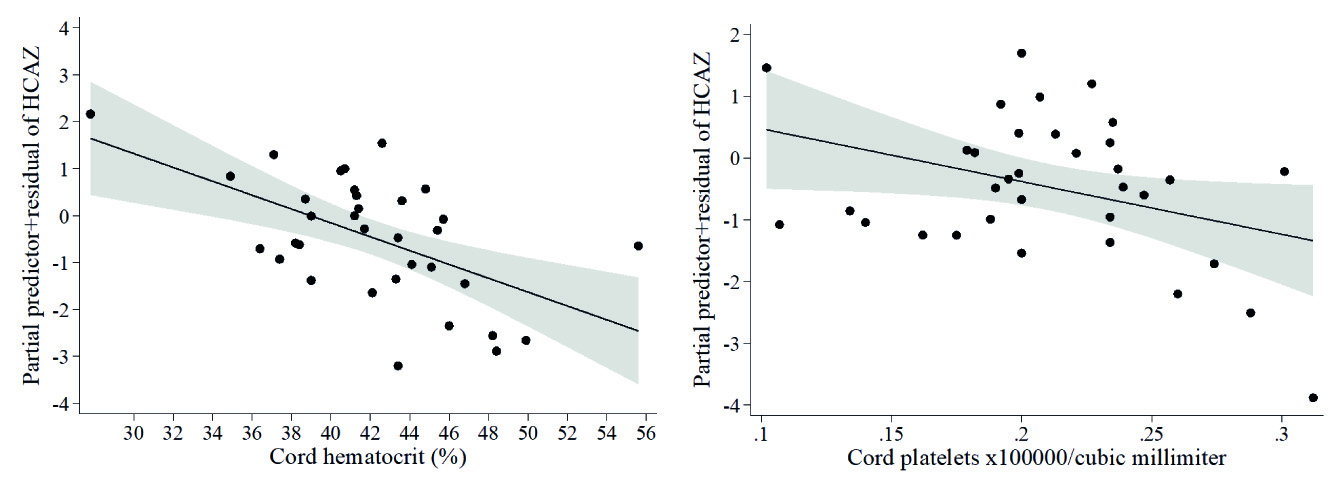
At term infant weights were within normal ranges. Lower infant weight measured in kg was associated with higher cord hematocrit (β= -0.44, model not shown), which was confirmed by the Z-scores of weight-for-age model (Table 5A, Figure 3A), and higher Z-scores of weight-for-length was associated with larger placental diameter (Table 5B, Figure 3B). Whereas no covariates emerged as significant in the multivariable fractional polynomial model for Z-scores of length-for-age, higher infant length (cm) was associated with higher cord sTfR (β= 0.37) and with lower maternal neutrophil count (β= -0.43), in a model that explained 18.5 % of the variability of infant length (model not shown). Given that neutrophils were within normal ranges in all mothers, we calculated the cut-point of neutrophils for detecting Z-scores of weight-for-length <-2, at >9.5 x10³/mm3. When including this cut point in the multivariable fractional polynomial model for newborn length, maternal neutrophils >9.5 x10³/mm3 were associated with lower infant length (Table 5C , Figure 4A), but maternal eosinophils (Table 5C, Figure 4B ) and older maternal age (Table 5C ) with higher infant length. Finally, lower head circumference (cm) was associated with higher cord platelet counts (β= -0.36) and higher hematocrit (β= -0.54) (model not shown), results that were reproduced in the model of Z-scores of head circumference-for-age (Table 5D , Figures 5A-5B).
Table 5 Multivariable fractional polynomial regression models for infant anthropometry.
| Coef. ± SE | p | 95% CI | β | Overall model | |
|---|---|---|---|---|---|
| 1 A. Z-scores of weight-for-age | |||||
| t Placental nodules (0=none, 1=pinpoint, 2=plaques) | 0.40 ± 0.21 | 0.061 | -0.02, 0.83 | 0.31 | Adj. R2= 0.269 p= 0.0091 |
| t Cord hematocrit (%) | -0.10 ± 0.03 | 0.005 | -0.17, -0.03 | -0.48 | |
| Constant | 0.11 ± 0.16 | 0.471 | -0.21, 0.44 | ||
| 2 B. Z-scores of weight-for-length | |||||
| t Placental diameter (cm) | 0.25 ± 0.07 | 0.002 | 0.09, 0.40 | 0.51 | Adj R2= 0.237 p= 0.0024 |
| Constant | -0.37 ± 0.17 | 0.035 | -0.71, -0.03 | ||
| 3 C. Birth-length (cm) | |||||
| t Gestational age, weeks | -0.19 ± 0.20 | 0.349 | -0.61, 0.22 | -0.15 | Adj. R2= 0.435 p ¿= 0.0004 |
| t Maternal age, years | 0.10 ± 0.04 | 0.010 | 0.03, 0.18 | 0.41 | |
| Maternal neutrophils >9.5 x10³/mm3 | -1.51 ± 0.42 | 0.001 | -2.36, -0.65 | -0.50 | |
| t Maternal eosinophil count x103/mm3 | 6.10 ± 2.21 | 0.010 | 1.57, 10.63 | 0.38 | |
| Constant | 51.66 ± 0.27 | <0.0001 | 51.11, 52.21 | ||
| 4 D. Z-scores of head circumference-for-age | |||||
| Cord platelet count x106/mm3 | -8.56 ± 4.13 | 0.047 | -16.98, -0.13 | -0.32 | Adj. R2= 0.270 p= 0.0029 |
| Cord hematocrit (%) | -0.15 ± 0.04 | 0.001 | -0.23, -0.06 | -0.56 | |
| Constant | -0.47 ± 0.19 | 0.019 | -0.86, -0.08 | ||
1 Z-scores of weight-for-age: Model variance inflation factor: 1.04, condition number: 1.22, n = 33. Variables that entered ≥500 bootstrap repetitions but that were taken out by the multivariable fractional polynomial selection process: placental diameter; maternal age, parity, systolic blood pressure, neutrophils and monocytes; cord monocytes, eosinophils*, mean corpuscular hemoglobin concentration and vitamin D.
t = Transformed variable. Equations used by the multivariable fractional polynomial process for covariate transformations:
Placental calcifications (0=none, 1=pinpoint, 2=plaques)= placental calcifications -1
Cord hematocrit (%)= Cord hematocrit - 42.03939415
2 Z-scores of weight-for-length: Variables that entered ≥500 bootstrap repetitions but that were taken out by the multivariable fractional polynomial process: maternal age, parity, maternal neutrophil/lymphocyte ratio, monocytes and mean corpuscular hemoglobin concentration; cord blood platelets, basophils, hematocrit, MCV and mean corpuscular hemoglobin concentration.
t = Transformed variable. Equations used by the multivariable fractional polynomial process for covariate transformations:
t Placental diameter (cm) = placental diameter- 20.13636364
3 Birth-length: Model variance inflation factor: 1.18, condition number: 2.33, n = 33. Variables that entered ≥500 bootstrap repetitions but that were taken out by the multivariable fractional polynomial selection process: newborn sex, maternal neutrophil/lymphocyte ratio and mean platelet volume; cord blood hemoglobin, hematocrit and MCV.
t = Transformed variable. Equations used by the multivariable fractional polynomial process for covariate transformations:
Gestational age (weeks) = gestational age - 39.42424242
Maternal age (years) = Maternal age - 23.78787879
Maternal eosinophil count = Maternal eosinophils - 0.1418181821
4 Z-scores of head circumference-for-age: Model variance inflation factor: 1.09, condition number: 1.34, n= 34. Variables that entered ≥500 bootstrap repetitions but that were taken out by the multivariable fractional polynomial process: placental diameter, maternal monocytes, mean corpuscular hemoglobin and RDW-CV.
Transformations of covariates:
t Cord platelet count x106/mm3 = Cord platelets - 0.210705881
t Cord hematocrit (%)= Cord hematocrit - 42.15588255
*One influential observation was omitted from analyses
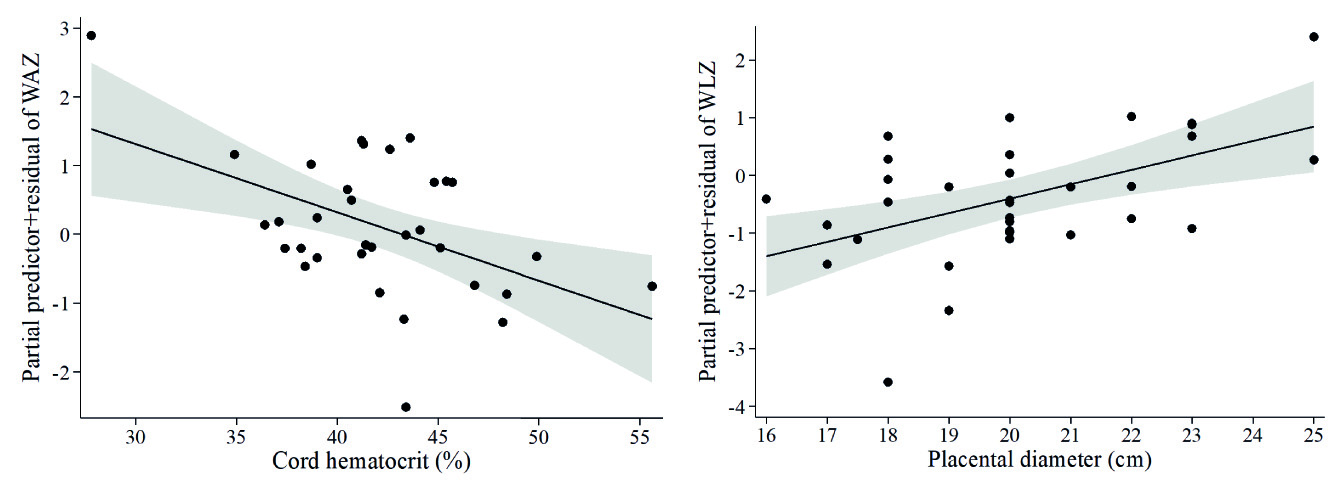
Figure 3 Fractional polynomial regression, adjusted for covariates, for associations of (A) Z-scores of weight-for-age (WAZ) with cord hematocrit, and (B) Z-scores of weight-for-length (WLZ) with placental diameter.
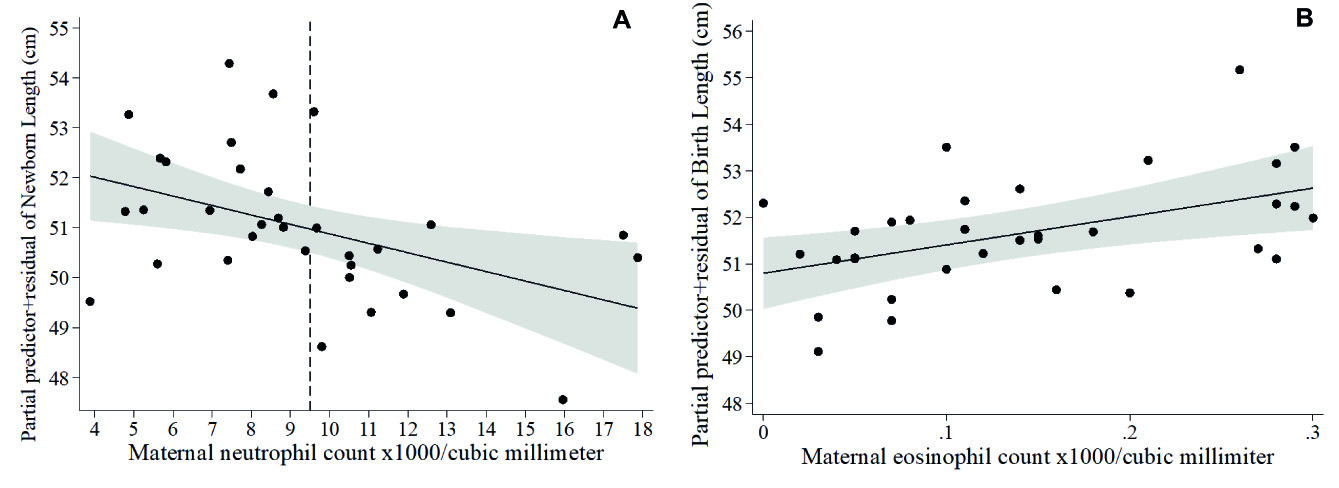
Figure 4 Fractional polynomial regression, adjusted for covariates, for associations of newborn length with (A) maternal neutrophil count (the dashed line denotes the cut-point of neutrophils for Z-scores of weight-for-length <-2 SD = 9.5 x10³/mm3 in our sample) and (B) maternal eosinophil count.
Discussion
Women from indigenous communities are among the most vulnerable populations, and our cohort provides evidence of factors associated with maternal and newborn health in the Ngäbe-Buglé community. In a context of uncomplicated term deliveries, we reported maternal inflammation and eosinophilia, and maternal and infant deficiencies in iron, vitamins A and D. We also reported the presence of risk of maternal hypertension evidenced by elevated mean arterial pressure and the presence of low maternal pulse pressure. High hematocrits and low calculated plasma volumes indicated inappropriate plasma expansion during pregnancy that could have compromised placental and fetal perfusion. Our findings of 35.3% low placental weight for gestational age, and 17.6% of infants with low head circumferences may be indicative of undetected adverse outcomes. Our data showed that both maternal and neonatal indicators of hemoconcentration were associated with lower placental weight (lower maternal plasma volume), and lower infant weight and head circumference (higher cord hematocrit), indicating that hemoconcentration is an overlooked risk factor for adverse pregnancy outcomes in this indigenous community. Moreover, biomarkers of inflammation in mothers (higher neutrophils) and neonates (higher platelet counts) were associated with lower newborn length and head circumference respectively. In contrast, two known immune-modulation factors, a higher fetal vitamin D and eosinophils, were positively associated with placental diameter. Finally, a maternal neutrophil count ≥9.5 x10³/mm3 was associated with lower infant length, but higher maternal eosinophils with larger infants. Our study shows that simple biometric and hematological routine measurements could help to identify neonates that require further clinical surveillance.
Factors associated with placental outcomes
Adverse pregnancy outcomes have placental insufficiency as a common mechanism, which places the fetus at increased risk of hypoxia and malnourishment, not only in small for gestational age, but also in adequate- and large- for-gestational-age fetuses, where placental insufficiency and ‘masked’ intrauterine growth restriction can happen 52. A lower plasma volume has been associated not only with lower placental weight but also with lower birthweights in Latin American women, in studies using a modified Evan's blue method to measure plasma volume 53,54. Moreover, it has been experimentally demonstrated that placental weight was reduced in rats with decreased plasma volume compared with controls 55) (56, therefore authors suggested that a low plasma volume reduced the exchange surface area between mother and fetus leading to intra-uterine growth retardation 56. These studies support our findings of reduced placental weight associated with lower maternal plasma volume, and the association of lower infant Z-scores of weight-for-length with lower placental diameter. Given the high prevalence of placentae with low weight for gestational age and the possibility of hemoconcentration, our findings support existing evidence that volume expansion during pregnancy is important for normal placental and newborn outcomes 53.
We also found that cord blood vitamin D was positively associated with higher placental diameter. A study in Denmark found that cord vitamin D at concentrations >60 nmol/L was associated with higher placental weights 57. Of note, in our study, only 3 participants had cord vitamin D >60 nmol/L, and still, higher concentrations of vitamin D were associated with greater placental growth. In contrast, a cohort of pregnant women from the US reported maternal vitamin D was associated with higher newborn weight and head circumference but not with placental weight 58. However, an Indian study showed that insufficient cord serum 25(OH)D enhanced placental inflammation in neonates born preterm 59. Authors suggested that the decreased expression of vitamin D receptor and cathelicidin anti-microbial peptide in placentae from preterm birth neonates in their study may have contributed to placental inflammation 59.
We know that maternal inflammation was present in this population given that C-reactive protein concentrations were higher than those reported at delivery in other studies 60-62, but C-reactive protein did not emerge as significantly associated with any of the placental or newborn outcomes. However, alternative biomarkers of inflammation, such as maternal neutrophils and eosinophils, and cord eosinophils and platelets, were associated with perinatal outcomes. Cord eosinophils emerged as associated with higher placental diameter, and maternal eosinophils with higher infant length at birth. Eosinophils are known to elicit a T-helper (Th)-2 response following intestinal nematode infection 63, and it has been previously demonstrated in mice that an intestinal nematode infection was associated with higher placental mass 64. Interestingly, we had previously described a high prevalence of intestinal nematode infections 23 and had reported that the nematode Ascaris was associated with decreased inflammation measured by C-reactive protein in this same population of indigenous pregnant Ngäbe women 24, suggesting that maternal nematode infections may also influence the fetal inflammatory response, favoring placental and newborn growth in this population.
Our findings together suggest that inflammation may be contributing to lower placental weight whereas higher newborn vitamin D status, might counterbalance the effect of inflammation on placental outcomes, in agreement with recent evidence that vitamin D deficiency experimentally decreased placental weight and diameter, downregulated placental nutrient transporters and produced placental insufficiency by inducing placental inflammation 65.
Factors associated with newborn anthropometry
It was interesting to observe that despite the range of maternal risk factors, newborns had normal birthweights. However, a significant association was observed between higher cord hematocrit and lower birthweight. Also, higher cord hematocrit and cord platelet counts were associated with lower head circumference. Others have described that maternal hemoglobin ≥110 g/L was associated with smaller infants 66) and cord hematocrit was higher in pregnancies with abnormal umbilical artery pulsatility index, an indicator of altered utero-placental blood flow, before or during labor 67. However, studies looking for associations between cord hematocrit and infant anthropometry are lacking. Higher infant hemoglobin and hematocrit but lower platelet counts have been described in small-for-gestational-age compared with adequate-for-gestational-age infants 68. Moreover, a negative association between platelet counts and hematocrit has been described in infants with polycythemia (hematocrit >65%), in whom lower platelet counts were associated with small for gestational age 69. These observations are in agreement with our finding of higher cord hematocrit associated with lower birthweights and head circumference, but contrast with the negative association of cord platelet counts with head circumference. There is evidence that an increased production and activation of platelets during pregnancy occur during inflammatory processes leading to platelet consumption and to a hypercoagulable state that impacts placental micro-circulation and placental insufficiency 70. Also, we had previously shown that higher plateletcrit was associated with higher C-reactive protein in pregnant and lactating Ngäbe women 24. Those findings support our association of lower placental weight and higher cord platelet counts with lower birth weights.
Platelet counts are known to be increased (>450 x106/mm3) during neonatal infections 71. In this study, although cord blood platelets were within normal ranges, most infants had low plateletcrit and low platelet volumes. A combination of low mean platelet volume and plateletcrit with high platelet number has been described as suggestive of reactive thrombocytosis, usually due to infection 72. Thus, our finding of higher platelets with lower Z-scores of weight-for-age and Z-scores of head circumference-for-age may be due to inflammation.
Our finding of higher maternal neutrophils associated with lower infant length continues to support the possible role of inflammation on infant outcomes. Recent literature has highlighted the role of not only nutrition but also endocrine and inflammation factors in the ethiology of stunting 73, particularly in developing settings where inflammation-related stunting starts in-utero 74. The association of maternal subclinical inflammation with stunting of breastfed infants has been reported previously in an indigenous population in Guatemala 75, which highlights the need to revisit cut-offs for the detection of subclinical inflammation in vulnerable communities.
Strengths and limitations
The inclusion of women at the time of delivery as subjects for research is difficult in remote settings where the majority of women deliver at home. We were able to overcome this limitation for this exploratory study as women during the last month of their pregnancy were able to move to a church-run home near the regional hospital in San Félix. Based on information provided by the Ministry of Health, we determined that we were able to recruit 65% of expected deliveries in the Comarca for a one month period from Nov-Dec 2010. Despite our convenience sample and our small sample size, application of bootstrapping statistical techniques revealed a sufficiently robust sample size to conduct an exploratory analysis and to identify biomarkers that could be used in the detection of women at risk of poor pregnancy outcomes. Since more than 50% of deliveries occurred at home, it is possible that those women reaching the hospital services may had been the ones with higher family/social support and households close enough to the town and with a lower risk for adverse pregnancy outcomes. Therefore, the reported 6.7% prevalence of low birth weights in 2010 in this indigenous population could underestimate adverse pregnancy outcomes of women that were not able to reach institutional delivery services.
Another limitation was that no pathology service was available at the time of the study and therefore we were not able to get a histological diagnosis of placental amnion nodules. Also, given the lack of international standards for placental weights, we used placental weights percentile curves derived from a North American population, where cord and membranes were removed before weighing, which was not done in our study.
Conclusion
In indigenous communities with a high prevalence of multiple infections, nutrient deficiencies and inflammation and access to only routine laboratory tests, assessment of maternal-infant health is often limited. Our results revealed that high hematocrit might be a useful early biomarker of mothers at risk for placental hypo-perfusion and poor in-utero growth in remote communities. We also found that despite normal birthweights, newborns had nutrient deficiencies that put them at risk of growth and development impairment, warranting close postnatal monitoring. Together these findings evidence under-utilized diagnostic applications for routine laboratory measures to assess maternal-infant health in field settings. Finally, our findings indicate that higher intakes of vitamin D may enhance placental growth and, if confirmed, should be recommended and supported by local health institutions.

