


Serviços Personalizados
Journal
Artigo
 Inglês (pdf)
 Artigo em XML
 Referências do artigo
 Enviar este artigo por email
Indicadores
-
 Citado por SciELO
 -
 Acessos
Links relacionados
-
 Citado por Google
 -
 Similares em
SciELO
Similares em
SciELO -
 Similares em Google
Compartilhar

 Permalink
Earth Sciences Research Journal
versão impressa ISSN 1794-6190
Earth Sci. Res. J. vol.18 no.2 Bogotá jul./dez. 2014
http://dx.doi.org/10.15446/esrj.v18n2.35887
A Semi-Automatic Approach to Identify First Arrival Time: the Cross-Correlation Technique (CCT)
Mustafa Senkaya1, Hakan Karsli1
1 Department of Geophysics Engineering, Karadeniz Technical University, Trabzon, Turkey
E-mail: msenkaya@ktu.edu.tr and hkarsli@ktu.edu.tr
Record
Manuscript received: 10/12/2012 Accepted for publication: 26/09/2014
ABSTRACT
The high-quality interpretation of seismic refraction data depends on the accurate and reliable identification of the first arrival times. First arrivals can be identified on a graphic or image by conventional picking, but this process depends on external factors, such as the scale and quality of the imaging data, amplitude ratio, sensitivity of the picking cursor and user experience. Under these considerations, identifying first arrivals in noisy data becomes more complex and unstable. In this study, the Cross-Correlation Technique (CCT), which is widely used in the process of analyzing reflection data, has been used to pick the first arrival times in noisy or noiseless seismic refraction data by a semi-automatic process. The CCT has reduced the dependence on user and decreased incorrect picking caused by environmental noise, displaying characteristics and scaling factors. The CCT has been tested with synthetic models with different noise contents and various field data. The Chi-square error criterion was used to assess the performance of the pickings. In addition, effects of small-time differences between the conventional picking process and the CCT have been demonstrated on a refraction tomography velocity section. Therefore, we believe that our proposed method is a useful contribution to the existing methods of first arrival picking.
Key Words: first arrival picking, first break, cross-correlation, seismic refraction, semi-automatic picking.
RESUMEN
La buena interpretación de datos estadísticos de refracción sísmica depende de la identificación acertada y confiable de los tiempos de llegada. Los primeros tiempos de llegada se pueden identificar en un gráfico o imagen por picado convencional, pero este proceso depende de factores externos como la escala y la calidad de información de la imagen, el índice de amplitud, la sensibilidad del cursor de recolección y la experiencia del usuario. Bajo estas consideraciones, la identificación de los tiempos de llegada bajo información ruidosa se vuelve más compleja e inestable. En este estudio, la técnica de Correlación Cruzada (CCT, en inglés), que es ampliamente trabajada en el proceso de análisis de datos de reflexión, se utilizó para seleccionar los primeros tiempos de llegada en información sísmica ruidosa o no ruidosa con un proceso semiautomático. La CCT redujo la dependencia en el usuario y bajó el nivel de selección incorrecta causada por el ruido ambiental al desplegar características y factores de escala. La CCT se ha probado en modelos sintéticos con diferentes contenidos de ruidos y diversa información de campo. El error de la norma Chi-cuadrado se utilizó para evaluar el desempeño de las selecciones. En adición, los efectos de las pequeñas diferencias de tiempo entre el proceso convencional de selección y la CCT se han demostrado en una tomografía reflexiva de velocidad. Además, se estima que el método propuesto es una contribución útil a los métodos existentes de la recolección de los primeros tiempos de llegada.
Palabras clave: Primeros tiempos de llegada, primer arribo, correlación cruzada, refracción sísmica, selección semiautomática.
1. Introduction
One of the principal methods for near-surface exploration is the analysis of seismic refraction data. This method conventionally requires the picking of first arrivals of direct and head waves on many shot records. Determining the arrival times of seismic events is the first step in the conversion of seismic observations to geological models. To obtain a high degree of consistency between travel time data and the seismic model, it is important to use appropriate data for f the inversion process (Leung, 2003). Generally, the identification of first arrivals in seismic refraction data depends on shallow geological structure, source type, and the signal to noise ratio (SNR). If the data are collected from complex geological structures or have low SNR, the automatic picking of the first travel times becomes a difficult process (Yilmaz, 2001).
First arrival picking techniques can be divided into manual and automatic (Cox, 1999). Manual picking depends on visual inspection of the amplitudes, operator's visual estimation capacity and experience, the scaling factor, and the quality of data imaging. These issues in data processing are time consuminging and can lead to inaccurate picks due to picking-operator subjectivity. Moreover, if seismic data contain various types of noise, the picking of first arrivals may not be simple and reliable. As a result, when the data volume is large and the data quality is poor, the picking procedure can take up to 20-30% of the total processing time (Sabbione and Velis, 2010).
Automatic picking techniques, on the other hand, involve machine picking according to certain criteria. They are more efficient than manual picking but may also lead to false picking (Mausa et al., 2011). Depending on the increase in the volume of data and the significant development of computer technologies in recent decades, many automatic or semi-automatic techniques have been developed to pick first arrivals. First studies for this purpose were based on the correlation of sequential traces and delay times between sequential arrival times (Peraldi and Clement, 1972). Hatherly (1982) used the least squares method with the first kick concept to define first arrival times. Gelchinsky and Shtivelman (1983), Ervin et al. (1983) suggested using the correlation properties of signals and statistical criteria. McEvilly and Majer (1982), Coppen (1985), Baer and Kradolfer (1987), Gu et al. (1992), and Earle and Sharer (1994) obtained first arrivals by using the energy ratios of signals. Murat and Rudman (1992), Kusuma and Fish (1993), and McComack et al. (1993) applied neural network algorithms on the seismic data to detect first breaks. Boschetti et al. (1996) and Xu et al. (1999) conducted fractal dimensional analysis to determine first arrivals on seismic traces. Yung and Ikelle (1997) used a bi-spectrum process instead of the traditional correlation method. Bois (1980), Liu and Fu (1982), and Wu and Nyland (1987) incorporated pattern recognition into the picking process. Keho and Zu (2009) presented an alternative approach using peak spikes and comparison of adjacent traces. Blais (2011) suggested the use of an optimization technique with an objective function and similarity of wave features. Liao et al. (2011) picked first breaks by spectral decomposition using minimum uncertainty wavelets. Mausa et al. (2011) presented a new technique for first arrival picking of refracted seismic data based on digital image segmentation. All techniques described above have advantages and disadvantages.
In this study, we propose to apply the CCT, which is an efficient approach in vibro-seismic reflection data processing, to extract reflectors, inon refraction data and detect first arrival times more accurately by semi-automatically process and. The Cross-Correlation (CC) process often produces side-lobes that arrive before the first break, thus complicating the picking process. To overcome this problem, we have developed a semi-automatic picking procedure. The entire process involves three steps. The first step of the method consists inof obtaining a source wavelet according to the noise content of the dat aa and using the source wavelet as an input to the CC process. The second stage is the cross-correlation between the source and traces in seismic refraction data. In the last stage, the first arrival times are automatically determined in the area marked by the user with linear lines on the cross-correlated output.
The effectiveness of the CCT is tested by means of noisy, noiseless synthetic and real data. Tests have shown that the method provides a faster and more reliable picking process, and it is an efficient approach to detect first breaks in all data types.
1.1 Factors Affecting the First Arrival Pickings
It is difficult to detect the first breaks in noisy seismic refraction data. Even ifwhen it is possible, general opinion is that the first arrivals are in the form of a nearly straight line, and since because the human eye works in this direction, the arrival times for each receiver loses sensitivity.
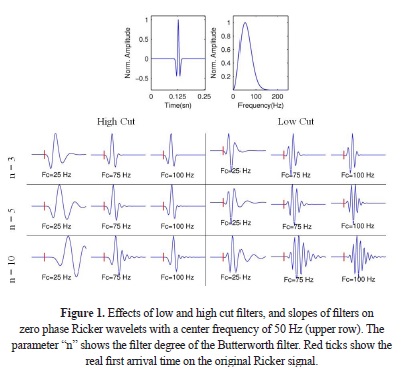
Filtering is the first option to make noisy data more understandable. However, the amplitudes of the first arrivasl have low energies and variable waveforms compared to other traces in the data. In that case, filtering is a troublesome process and sometimes it may cause erroneous results. Moreover, different filter band ranges and slopes have some characteristic effects on signals. Filtering low frequencies increases the side lobe of the signal. In contrast, the signal waveform the signalis extended without affecting the any side lobes when using high-cut filters. The filter slope is another parameter impacted by the filtering process. The energy of the wavelet tends to shift with an increasing slope of the filter (Geldart and Sheriff, 2004). These effects are shown on a zero-phase Ricker wavelet in Fig. 1 by Butterworth filtering, with different frequency bands and slope values. Red ticks on the filter outputs indicate the real first break times. However, when the slope and high cut frequency of the filter increase, the first break points apparently move forward from the real point. In contrast, when the slope and low cut frequency of the filter increase, the first break points remain constant, but side lobes exist, leading to false picking.
The difficulties in the conventional process of first arrival picking, especially for noisy data, are related to numerous effects, such as human operator experience, sensitivity and capacity of the operator's eyes, scale of the imaging and data amplitude, sensitivity of the picking cursor axes, and SNR. Therefore, the process is time consuming.
The imaging scale and amplitude of the data directly affect the accuracy of the picked time (Douglas et al. 1997). The first arrivals picked at low-level amplitudes have delays compared to those picked at high levels because some earlier low-amplitude events will be masked by high levels, and normalization is not sufficient in these cases. Time scale is important to the sensitivity of the picking cursor. If the cursortime axis is too narrow, the sequenced picked times may appear very similarsimultaneously, which will cause an inaccurate picking.usesthe alsthe values
All the above-mentioned factors appear in the conventional picking process of the first breaks, which is performed on "an image" by clicking or marking. To overcome the difficulties inherent toin the traditional process, picking must be done directly with the numerical values of amplitudes and be performed independently for each channel by mathematical approaches and attributes. In this paper, an attempt is made to devise a simple and quick procedure, the CCT, to obtain accurate and sensitive first travel times in refraction data.
2. Method
Our method is based on the simple and practical CC technique. It is well known that the CC process is not affected by random noise in signals. This is an unique and useful feature of the CC process under noisy conditions. It can permit us to obtain travel times independently of noise, and it is possible to increase the quality of first breaks.
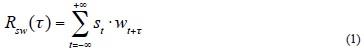
From Eq. (1), CC requires two inputs in the time domain: data st and the source wavelet wt. If the seismic data are modeled as a linear system, the source wavelet becomes an input, the linear system is a homogeneous layered earth, and the output is the refraction data. According to this linear system, each seismic refraction datum is influenced by its source. Therefore, the correlation function, which is generated by the CC of the refraction signals and source, has a maximum correlation value where the data and source wavelet appear to be the same waveform or shape. Consequently, the first break time is defined as the time of the maximum correlation value on the time axis.
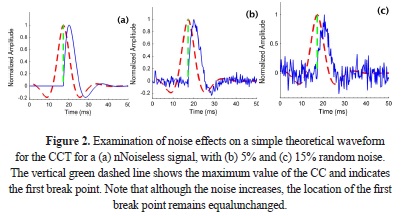
The theoretical accuracy of the proposed method has been shown in Fig. 2(a) on a simple and noiseless synthetic signal generated by the previously mentioned linear system. The correlation function, the CC of the source and data, has a maximum correlation value where itthe function entirely matches with the first break at 17.25 ms. To demonstrate the success of the CC process under the random noise condition, this basic application was repeated with 5% and 15% random noise (Fig. 2(b), 2(c), respectively). In both cases, the maximum correlation value indicates itself on the same theoretical first break time as in the noiseless one.
3. Synthetic Applications
The CCT was tested by means of synthetic models under different noise conditions. In the synthetic tests, data were generated by the convolution of a modified sine wave as a source with an impulse series that had a single impulse for each channel on the calculated theoretical wave travel time sample (Fig. 3). Our earth model was based on the superposition of a horizontally layered, homogenous model, and we confine ourselves to a single interface with parameters as given in Table 1.
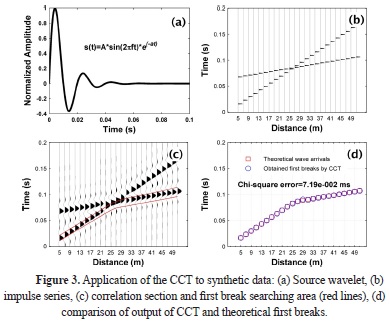
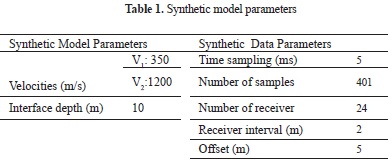
Figure 3(d) indicates the results of the CCT on 24 channels of noiseless synthetic seismic refraction data. The semi-automatic picked times havehad high accuracy compared to theoretical wave arrivals. This consistency was demonstrated by a chi-squared error value with a 95% confidence interval. Figure 3(c) shows flagged lines, which were used to restrict the automatic search area of first breaks. This restriction must be applied to shorten the process time and reduce failed picks under real field conditions that may have several maximum correlation values at late times caused by side-lobes.
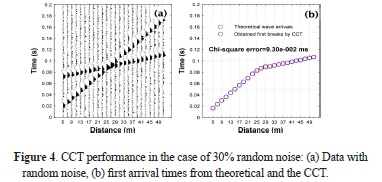
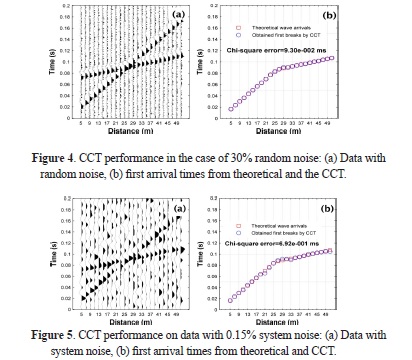
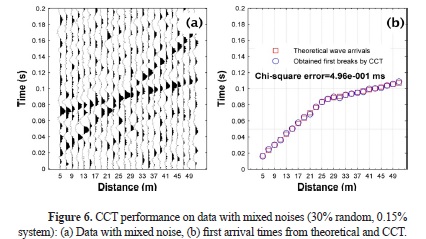
The synthetic tests were extended to data with three different noise contents: i) 30% random noisy data as high-frequency noises (Fig. 4), ii) 0.15% system noise as low frequency, coherent noise (Fig. 5), and iii) mixed noise as both 30% random and 0.15% system noise (Fig. 6). While first breaks were determined with 9.30*10-2 ms and 6.92*10-1 ms chi-squared error for the data for random and system noises data, respectively, the error value was 4.96*10-1 ms for the mixed noisy data. These results demonstrate that the CCT is an useful process even in the case of different levels of noise because of the nature of the CC process.
4. Real Data Examples
Data were gathered from different fields containing various frequencies and types of noise to demonstrate the flexibility of this method. Data sets were provided by the Seismic Data Process Group at the Geophysical Engineering Department of Karadeniz Technical University, in Trabzon, Turkey. All field data were collected at 12 receivers with varying spreads on a ES3000 seismograph by 8 kg hammer impacts, using a time sampling of 0.25 ms.
In the semi-automatic process, we hadencountered two major issues: i) polarity changes between channels, ii) source wavelet estimation for the data that is acquired from uncontrolled sources. Polarity changes of waves are caused by complex or inordinate near-surface conditions. In the last stage of the CCT, first breaks are searched in the marked area as a maximum correlation function value. In the case of a polarity change, the correlation function assumes a negative rather than positive maximum value. Therefore, the automatic searching for first breaks must be applied to absolute values of the correlation function to avoid affecting polarity changes.
The selection of an optimum source type in field studies relates to the desired source wavelet, portability, cost, repeatability, and environmental damage and safety factors. Considering these factors, the uncontrolled sources, such as hammer and weight-drop apparatus, are the most suitable ways to acquire seismic refraction data sets. However, In addition tothe source shapes and the frequency band ranges of uncontrolled sources generally change between shots, so they are not completely explained by fixed mathematical functions. This situation is a considerable issue for CCT applications in uncontrolled source data. Eq. (1) shows that a source wavelet function is necessary for CC and is a single and dominant input to generate a reliable correlation function and travel time. Therefore, a reliable estimation of the seismic source can be a pivotal point for a successful picking process.
We offer three ways to determine the source wavelet function from uncontrolled source data: i) by choosing a wavelet on the trace with high SNR, ii) by inverse Fourier transformation according to center frequency of a smooth average power spectrum of the data, iii) by generating suitable mathematical operator functions. According to noise content, the user must decide which option is most appropriate.
Our experiences have shown that seismic refraction data can be divided into four categories according to noise content and ease of picking the first arrival times:
a) nearlyNearly noiseless data with clear first arrivals
b) Data containing high frequency environmental noises (i.e. industrial and traffic)
c) Data with an altered waveform for most receivers and unknown noise sources in the subsurface or on the ground
d) Data with very low SNR, in which it may be impossible to pick first breaks
Our experimental analyses show that the source wavelet can be estimated directly on a clear channel for a-type data, whilea the smooth spectrum approach is very useful on b-types. To generate a source function in the cases of c and d-types, a mathematical operator will be suitable. Moreover, a mathematical function can be adapted to data with numerous minimum phase function approaches. We shall concentrate on a source estimation step because of its direct importance to the accuracy of the time picking. If possible, it has been suggested that the source wavelet to be used should initially be chosen on a clear channel.
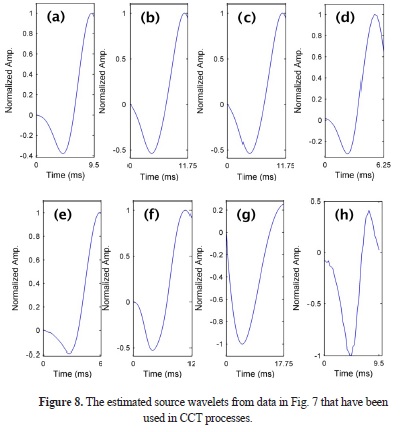
CCT applications have been illustrated several times for each type of real data to verify effectiveness and usability. First arrivals picked from clean data with high accuracy can be observed in Fig. 7(a) and 7(b). Applications of the proposed method on high and low frequency noises are shown in between Fig. 7(c) and 7(f), and Fig. and respectively. Fig. 7(g) and 7(h) illustrate instances of the picking with a mathematical operator and smooth spectrum application on hard data compared with others. We used the earlier part of a modified sine function as a mathematical operator. Furthermore, the estimated source wavelets have been shown in Fig. 8, following the same sequences in the data imaging. Effectiveness and accuracy of the CCT directly depend on the estimated source wavelet. We suggest using the half the length of the estimated source wavelet in the CCT. However, our tests indicate that when the data includes more noise, the length may be longer.
Refraction tomography is becoming a common method to estimate the accuracy of near-surface velocity models. This process also depends on the picking of first arrivals of refracted data and tomographic inversions are very sensitive to each individual travel time. One of the main difficulties with the refraction tomography is the low SNR characterizing the first break waveform, especially for far-offset receivers. Moreover, our experiences have shown that other seismic refraction data interpretation methods, such as the Delay Time Method, can also be affected. Therefore, we want to demonstrate that small time differences between first arrivals may have a substantial effect on seismic velocity and thickness sections.
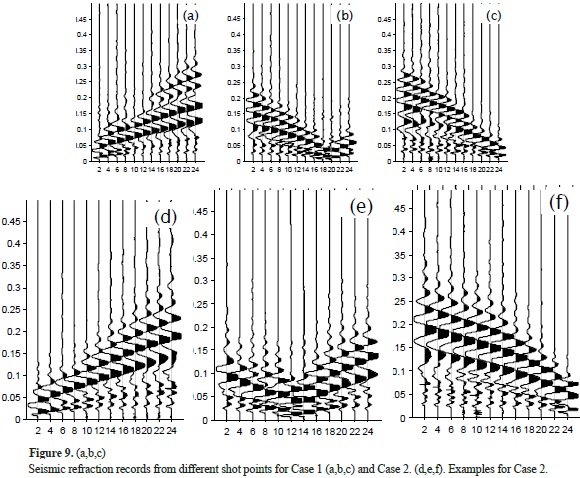
We used two different seismic refraction data sets (Cases 1 and 2) that were recorded with 12 channels to search sliding surfaces in a land-fill area interface. Some shots for Cases 1 and 2 are illustrated in Fig. 9. is The data does not include more noise than the data of types a and b. We chose this data set specifically to demonstrate the importance of small time differences between traditional picking and the CCT in tomographic solutions. However, because we lack well-log information about the working area, we avoid comparing both tomographic results in terms of structural interpretation. Therefore, we prefer to work with reliable and fairly clear data sets. Both data sets were picked using the traditional method and CCT (Fig. 10). The obtained maximum, minimum and mean absolute time differences of first breaks for each shot are shown in Table 2 for each case. We used to the same tomographic inversion parameters for both data sets in each case to makeprovide a better comparison. Tomographic results for Cases 1 and 2 are shown in Figs. 11 and 12, respectively. Generally, the depth of layer interfaces are nearly the same, but their resolution and stability are comparable. This is exactly our main intention.
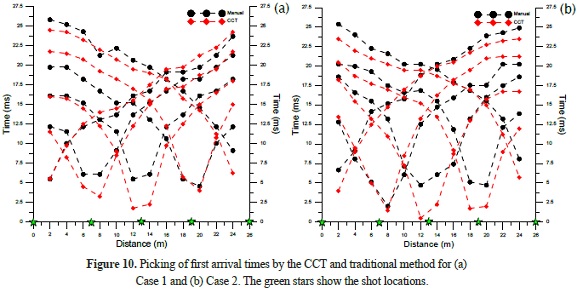
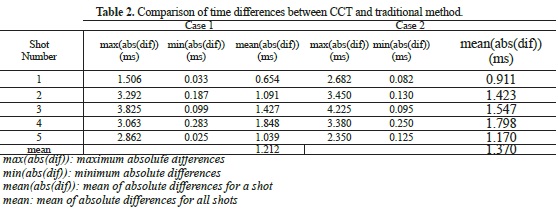
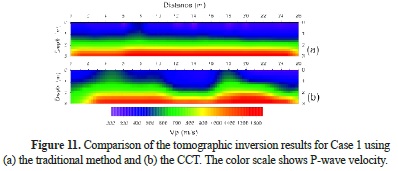
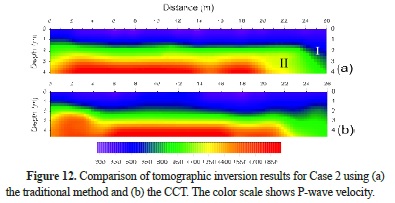
In Table 2, the mean absolute time difference for Case 1 is 1.212 ms.. Although this value seems small, it can cause unexpected effects on the solution. At the first glancesight of Fig. 11, layer interfaces are flatter in the traditional result, so the lateral resolution is lower than that obtained by the CCT. This result occurs because the human operator inherently desires to pick first breaks on an approximately straight line and based on a trend of first breaks on neighboring channels. Therefore, each channel cannot be evaluated independently in the traditional picking procedure; thus, the dependency inherently causes loss of resolution. In contrast, in the CCT, first breaks are picked independently on each channel. In this way, the lateral resolution of velocity sections can increase, and more reliable results can be obtained. In Fig. 11, the area between 23-26 m on the first layer interface (marked by I) is unexpectedly truncated instead of continuing toward the end of the line. In contrast, the continuity of the first layer interface in this area can be clearly observed from the CCT section. Moreover, the traditional velocity section has a scattered and nebulous area for the second layer interface between 20-23 m (marked by II), but this area is more stable in the CCT section. In Case 2, the increases in lateral resolution for the first and second interface are clearly seen in the whole CCT section, even though the mean difference is only 1.370 ms between data sets.
5. Conclusions
In this paper, we introduce a new procedure based on a semi-automatic first arrival pick, called the CCT. The procedure overcomes traditional picking difficulties and provides an accurate, reliable method of picking first arrival times with a basic mathematical approach. The obvious benefits of the CCT are that the algorithm allows detection of travel times on each channel independently and reduces misleading human operator effects. Moreover, the picking of first arrivals can be performed without random noise and complex near surface effects due to the nature of CC. Synthetic and real data examples show that the estimation of a seismic source is the pivotal decision for success because the source function is the basic information being searched for during the CC process. Hence, if the input of CC has ambiguities, the correlation section may produce deceptive correlation values. To avoid possible erroneous picking, the user must maintain an active position during the determination of the possible source wavelet and mark borders of an automatic searching area on the correlation section. The resulting tomograms show that small time differences in first break pickings are important and effective on all results that can be obtained from refraction data.
Acknowledgements
This work was funded by Karadeniz Technical University-Scientific Research Foundation (Project code no: 2009.112.007.2). Additionally, we would like to thank the anonymous reviewers and editors for their useful comments, which allowed this paper to be improved.
References
Baer M and Kradolfer U. (1987). An automatic phase picker for local and teleseismic events Bulletin of Seismological Society of America 77 1437-1445. [ Links ]
Blais E (2011) Optimization approach to automatic first arrival picking for three-component three-dimensional vertical seismic profiling data Geophysical Prospecting Early view version. [ Links ]
Bois P (1980) Autoregressive pattern recognition applied to the delimitation of oil and gas reservoirs Geophysical Prospecting 28 572-591. [ Links ]
Boschetti F, Dentith M D and List R D (1996) A fractal-based algorithm for detecting first arrivals on seismic traces Geophysics 61 1095-1102. [ Links ]
Coppen F (1985) First arrival picking on common-offset trace collections for automatic estimation of static corrections Geophysical Prospecting 33 1212-1231. [ Links ]
Cox M (1999) Static corrections of seismic reflection surveys (Society of Exploration Geophysics - Geophysical Reference Series Tulsa OK USA). [ Links ]
Douglas A, Bowers D and Young J B (1997) On the onset of P seismograms Geophysical Journal International 129 681-690. [ Links ]
Earle P S and Shearer P M (1994) Characterization of global seismograms using an automatic-picking algorithm Bulletin of Seismological Society of America 84 366-376. [ Links ]
Ervin C P, McGinnis L D, Otis R M and Hall M L (1983) Automated analysis of marine refraction data: a computer algorithm Geophysics 48 582-589. [ Links ]
Gelchinsky B T and Shtivelman V (1983) Automatic picking of first arrivals and parameterization of traveltime curve Geophysical Prospecting 31 915-928. [ Links ]
Geldart P L and Sheriff R E (2004) Problems in Exploration Seismology and Their Solutions (Society of Exploration Geophysics - Geophysical Reference Series No.14 Tulsa OK USA) p 251. [ Links ]
Gu H, Zhou H and Zhang X (1992) Automatic pick of first arrival time Geophysical & Geochemical Exploration 16 120-129. [ Links ]
Hatherly P J (1982) A computer method for determining seismic first arrival times Geophysics 47 1431-1436. [ Links ]
Keho T H and Zhu W (2009) Revisiting automatic first arrival picking for large 3d land surveys SEG Houston 2009 International Exposition and Annual Meeting (Dhahran Saudi Arabia) p.3198-3202. [ Links ]
Kusuma T and Fish B C (1993) Toward more robust neural-network first break and horizon pickers Soceity of Exploration Geophysics 63rd Annual Meeting, (Washington, DC). [ Links ]
Leung M T (2003) Controls of traveltime data and problems of the generalized reciprocal method Geophysics 68 1626-1632. [ Links ]
Liao Q, Kouri D, Nanda D and Castanga J (2011) Automatic first break detection by spectral decomposition using minimum uncertainty wavelets Soceity of Exploration Geophysics 81st Annual Meeting (San Antonio) p.1627-1631. [ Links ]
Liu H H and Fu K S (1982) A syntactic pattern recognition approach to seismic discrimination Geoexploration 20 183-196. [ Links ]
Mausa WA, Al-Shuhail A A and Al-Lehyani A (2011) A new technique for first-arrival picking of refracted seismic data based on digital image segmentation Geophysics 76 79-89 . [ Links ]
McCormack M D, Zaucha D E and Dushek D W (1993) First-break refraction event picking and seismic data trace editing using neural networks Geophysics 58 67-78. [ Links ]
McEvilly T V and Majer E L (1982) ASP: An automated seismic processor for microearthquake networks Bulletin of Seismological Society of America 72 303-325. [ Links ]
Murat M E and Rudman A J (1992) Automated first arrival picking: A neural network approach Geophysical Prospecting 40 587-604. [ Links ]
Peraldi R and Clement A (1972) Digital processing of refraction data study of first arrivals Geophysical Prospecting 20 529-548. [ Links ]
Sabbione J I and Velis D (2010) Automatic first-breaks picking: New strategies and algorithms Geophysics 75 V67-V76. [ Links ]
Al-Ghamdi A S (2007) Automatic first arrival picking using energy ratios MS Thesis (King Fahd University Of Petroleum And Minerals) publication number 1451102. [ Links ]
Wu X and Nyland E (1987) Automated stratigraphic interpretation of well log data Geophysics 52 1665-1676. [ Links ]
Xu C, Yike L and Ashida Y (1999) Hausdorff fractal algorithm for picking first break in seismic traces Geophysical Exploration 52 316-322. [ Links ]
Yilmaz O (2001) Seismic data analysis: processing, inversion and interpretation of seismic data Society of Exploration Geophysicists, Tulsa Oklahoma. [ Links ]
Yung S K and Ikelle L T (1997) An example of seismic time picking by third-order bicoherence Geophysics 62 1947-1951. [ Links ]
