


Serviços Personalizados
Journal
Artigo
 Inglês (pdf)
 Artigo em XML
 Referências do artigo
 Enviar este artigo por email
Indicadores
-
 Citado por SciELO
 -
 Acessos
Links relacionados
-
 Citado por Google
 -
 Similares em
SciELO
Similares em
SciELO -
 Similares em Google
Compartilhar

 Permalink
Earth Sciences Research Journal
versão impressa ISSN 1794-6190
Earth Sci. Res. J. vol.20 no.1 Bogotá jan./mar. 2016
https://doi.org/10.15446/esrj.v20n1.37601
http://dx.doi.org/10.15446/esrj.v20n1.37601
Assessment by multivariate analysis of groundwater-surface water interactions in the Coal-mining Exploring District, China
Evaluación de las Interacciones entre Agua Superficial y Agua Subterránea a Través del Análisis Multivariante en el Distrito de Exploración Carbonífera en China
Pinghua Huang1*, Sumin Han2
1 Institute of Resources and Environment, Henan Polytechnic University, Jiaozuo, 454000, China.
2 School of Electrical Engineering and Automation, Henan Polytechnic University, Jiaozuo, 454000, China. E-mail: hansumin@hpu.edu.cn
* Corresponding author. E-mail: hph2001@hpu.edu.cn.: Tel: +86-15893039167
Record
Manuscript received: 26/03/2013 Accepted for publication: 13/11/2015
How to cite item
Huang, P. & Han, S. (2016). Assessment by multivariate analysis of groundwater-surface water interactions in the Coal-mining Exploring District, China. Earth Sciences Research Journal, 20(1), G1-G8. doi: http://dx.doi.org/10.15446/esrj.v20n1.37601
ABSTRACT
This paper applies for cluster analysis and factor analysis theory to statistically analyze environmental isotope (δ18O,δ2H, 3H, 14C) and water chemistry (K+, Na+, Ca2+, Mg2+, HCO3 -, SO42-, Cl-) test data from different water bodies in the coal-mining exploring district. The result shows that groundwater can be clustered into four categories, namely GA, GB, GC and GD classes. Deep karst groundwater and spring were grouped into GA class, and the contour map of the second-factor scores shows that karst water and spring of the GA group is in the same area, indicating the same recharging source from the northern mountainous area. Deep fissure water was clustered into GC class with the lowest second-factor scores, and cation exchange plays a central role, then did not detect tritium with 14C of lower levels, indicating the late Pleistocene rainfall recharging. Shallow pore water and surface water were clustered into GB class with the high third factors scores, indicating surface water leakage recharging. The water samples of GD class have the highest three factors score, pointing out that the shallow pore water and surface water were polluted. The results of this study provide a scientific basis for assessing groundwater circulation mechanism in the coal-mining exploring district.
Keywords: Cluster analysis, factor analysis, isotope geochemistry, groundwater circulation, coal mining district.
RESUMEN
Este estudio utiliza la teoría del análisis de grupos y del análisis factorial para examinar estadísticamente la información de pruebas al isótopo ambiental (δ18O,δ2H, 3H, 14C) y a la química del agua (K+, Na+, Ca2+, Mg2+, HCO3 -, SO42-, Cl-) en diferentes cuerpos de agua en el distrito de exploración carbonífera. El resultado muestra que el agua subterránea puede ser agrupada en cuatro categorías, nombradas Clase GA, Clase GB, Clase GC y Clase GD. El agua subterránea del karst profundo y el agua de manantial fueron agrupadas en la Clase GA; el mapa topográfico de los marcadores de segundo factor muestra que el agua del karst y el agua de manantial del grupo GA se encuentran en la misma área, lo que indica que tienen la misma fuente de recarga, en la región montañosa al norte del distrito. El agua de las fisuras profundas fue agrupada en la Clase GC con los marcadores más bajos de segundo factor y donde el intercambio de cationes es determinante; no se detectó tritio con los bajos niveles de 14C, lo que indica una recarga por lluvia en el Pleistoceno tardío. El agua poco profunda y el agua superficial fueron agrupadas en la Clase GB, con los mayores marcadores de tercer factor, lo que indica una recarga por vertido superficial. Las muestras de agua de la Clase GD tienen los mayores marcadores de los tres factores, lo que señala que las aguas poco profundas y las superficiales están contaminadas. Los resultados de este estudio proveen una base científica para la evaluación del mecanismo de circulación del agua subterránea en el distrito de exploración carbonífera.
Palabras clave: Análisis de grupos, análisis factorial, geoquímica isotópica, circulación de agua subterránea, distrito de exploración carbonífera.
1 Introduction
Over the last few decades, as China's exploitation of underground coal has gone deeper and deeper, mine displacement also enhances gradually, the groundwater table assumes coming down in the successive years. For example, groundwater was already dredged trunk in some shallow aquifers in the coal-mining district of Jiaozuo, one of the famous karst mining areas in China, the result is of which amount of salinity was accumulated. On the other hand, besides part of pit groundwater was exploited by the factories, the majority of which were untreated and directly discharged to rivers. The paper beliefs that contaminated river supplies the shallow aquifer in the leakage area, and severely affects irrigation and domestic water. To provide a scientific basis for groundwater security assessment in coal-mining districts, it has become necessary to probe into the hydraulic connections between groundwater-surface water and the sources of groundwater recharge.
Several studies using hydrochemistry and stable isotopes of water have not only already been undertaken to characterize recharge processes in similar karst-dominated geological settings (Marifia et al., 2003; Long and Putnam, 2004; Barbieri et al., 2005; Aravena and Suzuki, 1990; Harrington et al., 2002), but they have also determined the main mechanisms of the water cycle, through study of the dynamic processes of different water bodies, such as their formation, movement, mixture and so on, in coal-mining districts (Duan et al., 1994; Gui et al., 2005).
In this study, multivariate statistical methods have been used to solve the hydrochemical classification and evolutionary laws of the groundwater in the coal-mining district of Jiaozuo. Multivariate analyses have been established as efficient tools in the analysis of hydrochemical data. Examples of the successful use of multivariate statistical methods in hydrochemical studies are contained in Steinhorst and Williams (1985), Farnham et al. (2003), Farnham et al. (2000) and Steinhorst et al (2001). Multivariate statistical methods do not indicate cause-and-effect relationships but they do provide information from which such relationships can be inferred.
The tracer technique of isotope and water chemistry, combined with multivariate statistical analysis theory, not only can describe the impact of different water bodies, but also can assess the uncertainty of the mixed model and the relationship of hydrogeochemical data in time and space during hydrological processes. The method plays a key role in the assessment of surface water-groundwater interaction (Farnham et al., 2000; Farnham et al., 2003; Steinhorst et al., 2001; Steinhorst and Williams, 1985; Aruga et al., 1995; Ashley and Lloyd, 1978; Bengrai et al., 2003; Helena et al., 2000; Hernandez et al., 1991; Join et al., 1997; Liedholz and Schafmeister, 1998; Meng and Maynard, 2001; Seyhan et al., 1985; Wang et al., 2001).
The purpose of this study is that is reasonably assessed under the environment of coal mining being serious, and the groundwater circulation mechanisms of the main aquifers are reasonable judgment in the coalmining district of Jiaozuo.
2 Hydrogeological setting
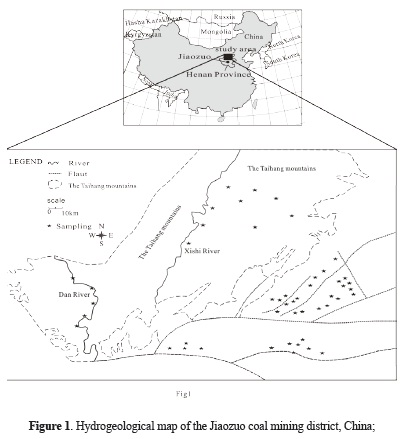
The Jiaozuo coal-mining district is situated on the southeast edge of the Mount Taihang uplift in China. The district is part of the tectonic system of New China and Qinling Mountains and the east wing of the frontal arc of the epsilon-type structural system in northwest Henan Province (Fig. 1). Due to the control of the Mount Taihang uplift, this place has mainly fault structure, folded structures being less developed, and the overall tendency is a monoclinic structure from south to east. The fault structures are mainly high-angle normal faults, which develop into three groups with the trend of E-W, NW-SE and NE-SW.
The water samples correspond to location in the study area. The Jiaozuo coal-mining district is situated on the southeast edge of the Mount Taihang uplift in China. The district is part of the tectonic system of New China and Qinling Mountains and the east wing of the frontal arc of the epsilon-type structural system in northwest Henan Province.
According to the lithology, thickness, water features and burial conditions of the stratum, the main groundwater aquifers from top to bottom, can be divided into three categories. Firstly is the shallow pore aquifer, made up of the Quaternary sandstone, clay, the thickness of which is 10-15m with permeability (K) 0.1 - 0.3 m/d. Secondly is the deep fissure aquifer, consisting of the sandstone, siltstone, the thickness of which is 30 - 40m with the permeability of the aquifer is about 1 - 3 m/d. Thirdly is deep karst groundwater aquifer, made up of the Carboniferous limestone with thickness 8 -12m and the Ordovician limestone with thickness about 400m, the permeability of which is about 1 - 30 m/d. The aquifers have complex boundary position and conditions with heterogeneous spatial distribution, anisotropic characteristics and irregular. Pumping (injecting) water test can form complete and unified funnel. The karst groundwater with uniform flow field and similar water level dynamic. Karst water flow from north to south and from west to East in the mining area. The water level is 240 - 2000 m in the wet season, and water level is 130 -160m in the dry season. The amplitude of annual water level ranged from 10 to 12m.The main aquitard among the aquifers are composed of alluvial mudstone.
The sampling points in the coal-mining district were selected where groundwater leakage has been detected from the shallow pore aquifer, the deep fissure aquifer, and deep karst groundwater aquifer.
The study area has a semi-arid and semi-continental monsoon climate, being located in the warm temperate zone, with average annual rainfall of 600 mm, total average annual evaporation 2048 mm (data from 1952 to 2001). North of the coal-mining district is the southern foothill of Mount Taihang, which is a tectonic denudation landform of low mountains with monoclinic structure. Three rivers originate from the southern foothill of Mount Taihang, the source of which is spring, extending in northward and westward directions and basically vertical to the anticline of Mount Taihang (Fig 1).
3 Materials and methods
3.1. Monitored parameters and analytical methods
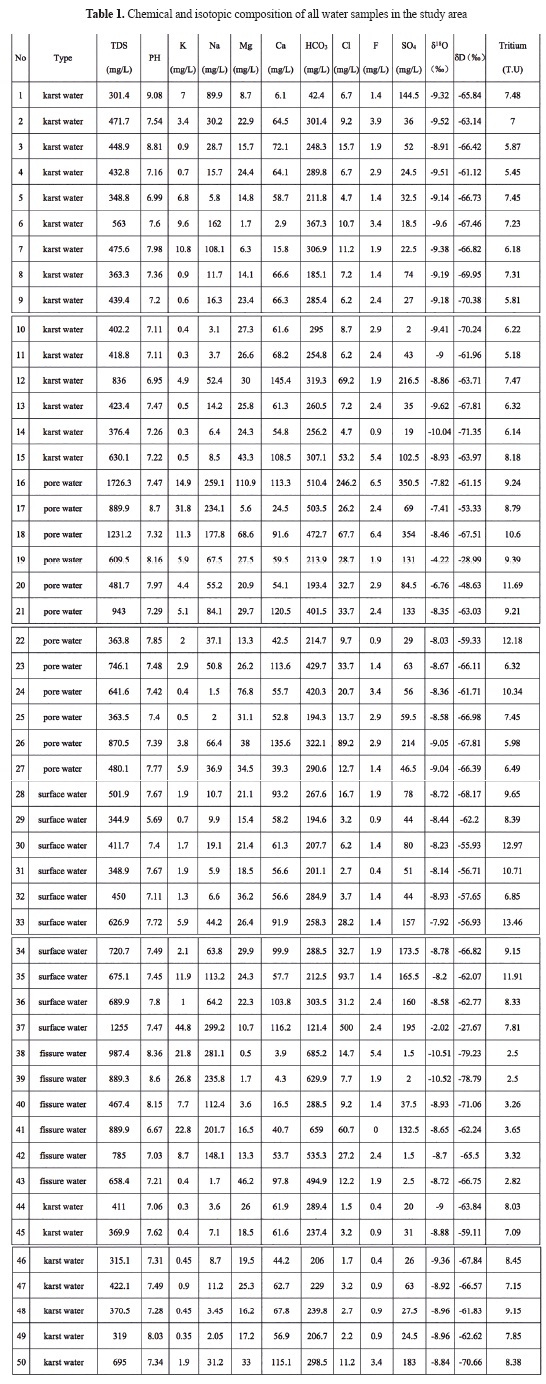
71 groups of water samples were collected from the coal-mining district in 2008, 2010 and 2011, including surface water samples, spring samples of Mount Taihang, deep karst groundwater, deep fissure water and shallow pore water. Water chemical and isotopic of all water samples were analyzed for TDS, PH, Ca2+, Mg2+, Na+, K+, HCO3-, SO42-, Cl-, F-, S18O, S2H, 3H, 14C (Table 1).
3.2 Cluster analysis
Cluster analysis theory studies how the object has been a comprehensive classification in accordance with many aspects characteristics, which can effectively solve the classification about the multi-factor study, the multi index, which has extensive application in Earth science (Steinhorst and Williams, 1985; Schot and Wal, 1992; Ribeiro and Macedo, 1995). In practical applications, hierarchical clustering (HCA) is the most commonly used (Steinhorst and Hodge, 2001), by which all samples were clustered in this paper. In the clustering process, all parameters of the samples were normalized by Z-Score method and sample spacing was defined by the Euclidean distance. The Euclidean distance usually gives the similarity between two samples and a distance can be represented by the difference between analytical values from the samples (Otto, 1998). Samples were classified according to square sum of deviations (Wards method). The Ward's method uses an analysis of variance approach to evaluate the distances between clusters in an attempt to minimize the sum of squares (SS) of any two clusters that can be formed at each step. The results are displayed with clustering pedigree chart (McKenna, 2003).
3.3 Factor analysis
Factor analysis method is a multivariate statistical analysis technique, which is used to concentrate the data , study dependencies between the variables, and explore the basic structure of the observational data which are expressed by several factors that can reflect main message which most of the observed variables contain, and that explain the interdependent relationship between these observed variables (Brown, 1998).In this paper, factor analysis method is applied by principal component analysis technique, which is the most commonly used (Welch and Lico, 1998; Ashley and Lloyd, 1978; Tao, 1998). When the eigen value is usually greater than 1 and the cumulative contribution rate is as large as possible, the common factors can be determined. Actual meaning of common factors is determined according to the loading of the observations which represent the correlations coefficient between analysis variables and the common factors.
4 Results
4.1 Hierarchical clustering results
Pedigree Fig 2 shows that the water samples were clustered into four categories (GA, GB, GC and GD groups), they can be clearly distinguished. Water chemistry types are classified by the Shug Kalev method (Wang, 1995). The Euclidean distance in the GA group which is made of spring and deep karst water with Ca-Mg-HCO3 type is the shortest. The GB group is mainly composed of surface water and shallow pore water. The SO42- concentrations of water samples up to average 114.7 mg / L in the GB group with Ca-Mg-HCO3-SO4 type are more than the other groups. The GC group with Na-HCO3 type which has high Na + concentration, low Ca2 + concentration is mainly composed of deep fissure water. The TDS, Cl-and SO42- contents of the GD group including three water samples (16 #, 18 # and 37 #) are significantly high. Water chemical type is Na-Cl-SO4 in the GD group. 16# and 18# water samples from shallow pore water are polluted by nearby factories, yet # 37 water samples from surface water is serious by man-made pollution.

The Euclidean distance in the GA group, which is made of spring and deep karst water with Ca-Mg-HCO3 type is the shortest. The GB group is mainly composed of surface water and shallow pore water. The SO42- concentrations of water samples up to average 114.7 mg / L in the GB group with Ca-Mg-HCO3-SO4 type. The GC group with Na-HCO3 type is mainly composed of deep fissure water. The TDS, Cl-and SO42- contents of the GD group including three water samples (16 #, 18 # and 37 #) are significantly high.
4.2 Statistical characteristics
Standard deviation such as TDS, HCO3-, Na+, Cl- of water samples is greater than 70, reflecting the obvious differences of water quality characteristics (Table 1). Box and whisker plots show the median of water quality parameters in the four clusters (GA - GB - GC - GD) (Fig 3).It shows that ions concentrations of the GD group are significantly higher than the others, reflecting the pollution characteristics, yet the Na+, Ca2+, Cl- concentrations of the GC group reflects the characteristics of the cation exchange.
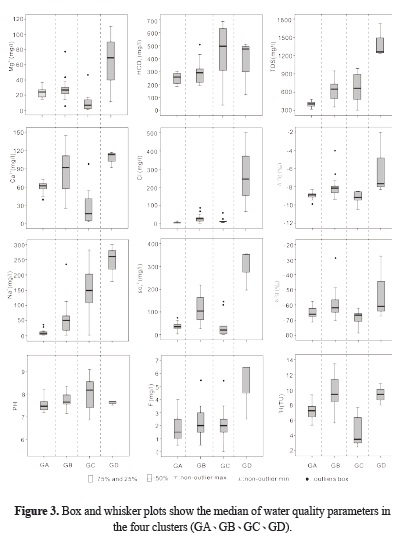
The ions concentrations of the GD group are significantly higher than the others, yet the Na+, Ca2+, Cl- concentrations of the GC group reflects the characteristics of the cation exchange.
4.3 Factor analysis results
R factor analysis was executed to all parameters of the water samples. Use principal component analysis to estimate the factor loadings matrix to obtain factors eigen values of more than 1. The cumulative contribution rate of the first four factors which can explain the most original data information is 84.04% (Table 2).
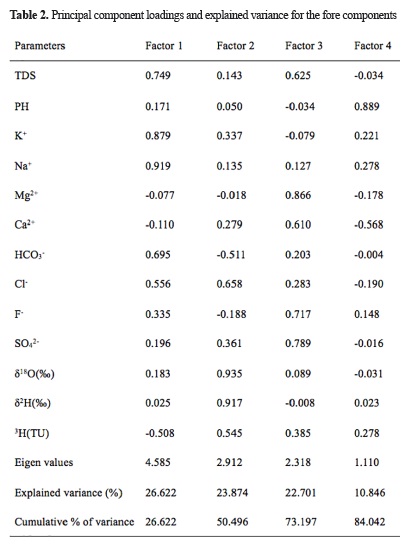
Extraction Method: Principal Component Analysis. Rotation Method: Varimax with Kaiser Normalization. Bold values: loadings>0.6.
So the extracted four factors (factor 1, factor 2, factor 3 and factor 4) are more scientific and reasonable. Table 2 shows that HCO3-, Na+ load of the first factor is more than 0.6 , reflecting groundwater alkalinity distribution, which is defined as the "alkalinity" factor (Fig 4). The S2H and S18O load of the second factor is more than 0.9, indicating the information of groundwater recharging source. The third factor has high positive load of Ca2+ and Mg2+, reflecting groundwater hardness distribution, which is defined as "hardness" factor. The fourth factor has only high correlation coefficient with PH which explains the distribution characteristics of groundwater acidic and alkaline. The actual means of the above four factors are very clear; therefore, all factor scores can be used to analyze groundwater space evolution.
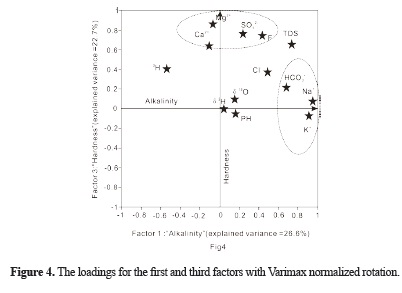
The factor 1 is defined as the "alkalinity" factor. The factor 3 has high positive load of Ca2+ and Mg2+, reflecting groundwater hardness distribution which is defined as "hardness" factor.
5 Discussion
5.1 Groundwater level and water quality changing in the coal-mining exploring district
The variation range of local annual rainfall is stable (450∼660mm), yet coal mine displacement has increased year by year since 1966. Shallow porous aquifer is the state of dewatering or dewatering in half. The buried depths of groundwater are more than 30m and deep karst water level also decrease in the mining district, indicating that the mine drainage leads to decreasing continuously groundwater level (Fig 5 ).
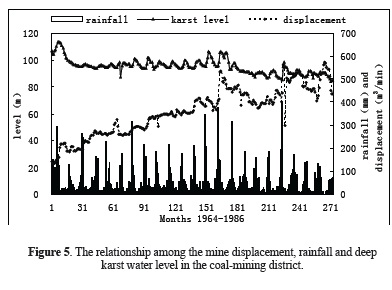
The variation range of local annual rainfall is stable (450 ∼ 660mm), yet coal mine displacement has increased year by year since 1966. Shallow porous aquifer is the state of dewatering or dewatering in half. The buried depths of groundwater are more than 30m and deep karst water level also decrease in the mining district.
Cl- concentrations and total hardness of shallow pore water and deep karst water had increased year by year. From 1995 to 2002 years, the Cl-contents of shallow pore water had increased from 13mg / L to 2135mg / L, and the Cl- contents of deep karst water had increased from 12mg / L to 112 mg / L, yet the total hardness had increased from 303mg / L to 403 mg / L.
Cl- concentrations and total hardness of shallow pore water and deep karst water had increased year by year. From 1995 to 2002 years, the Cl- contents of shallow pore water had increased from 13mg / L to 2135mg / L, and the Cl- contents of deep karst water had increased from 12mg / L to 112 mg / L, yet the total hardness had increased from 303mg / L to 403 mg / L (Fig 6).
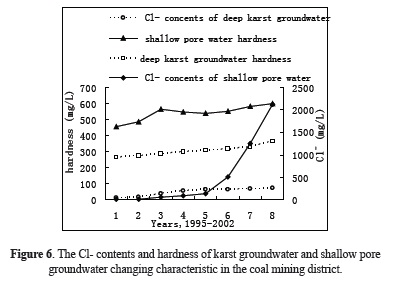
The above data shows that the shallow and deep groundwater quality has become worse in the mining district, especially the Cl- contents of shallow pore water have increased significantly. The coal mining has brought about that the groundwater balance has been severely broken and the condition of groundwater recharging, runoff and excretion has changed.
5.2 Groundwater circulation mechanism in the coal-mining exploring district
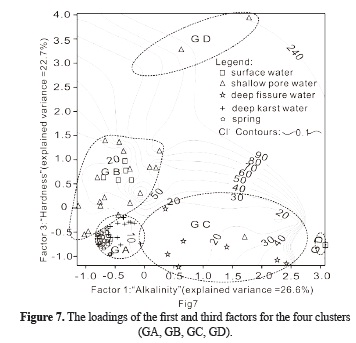
From Mount Taihang to coal mining district, the first factor scores, the third factor scores and Cl- contents of karst water which belongs to the GA group increases gradually (Fig 7), indicating salt accumulating gradually and groundwater lateral recharging process.
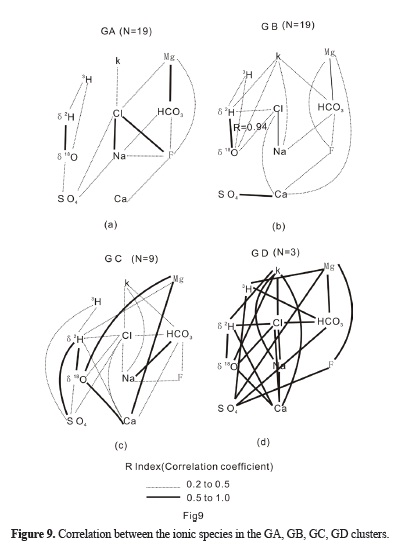
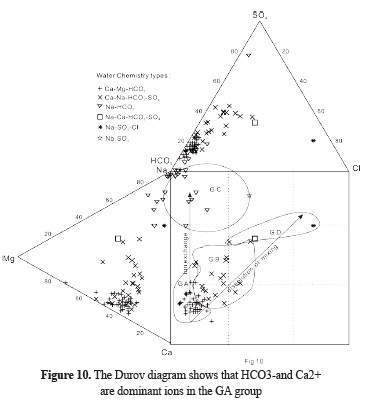
Groundwater lies the starting end of runoff evolution, which is often considered as recharging source (Lloyd and Heathcoat, 1985). The contour map of the second factor scores shows that karst water and spring of the GA group is at the same area, indicating that karst water mainly accept recharging from spring (Fig 8 (b)).The euclidean distance in the GA group clustering is the shortest, indicating that deep karst water and spring experienced the roughly same hydrogeochemical environment. Fig 9 (a) shows that the correlation coefficients of about Cl, Na, F and between Mg to HCO3 are more than 0.5, indicating that the rock salt and dolomite dissolving are the dominant groundwater evolution process in the GA group. The Durov diagram shows that HCO3-and Ca2+ are dominations in the GA group, further confirming the above conclusions (Fig 10).
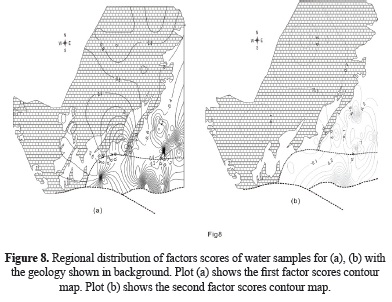
From Mount Taihang to coal mining district, the first factor scores, the third factor scores of karst water which belongs to the A group increases gradually (Fig 7).
The second factor scores variation ranges of shallow pore water in the GB group are from -0.3 to -0.9, and the dominant anion and cation gradually become obvious along the X-axis direction in Figure 10, indicating the groundwater mixing process. Shallow pore water has the high second factor scores in the GB group, indicating that the S18O and S2H values are more positive, which reflect surface water recharging characteristic. There are excellent correlations among K, Na, Ca,18O (Fig 9 (b)), indicating that the runoff process of shallow pore water in the GB group, because the FeS oxidized of Carboniferous-Permian coal seams bring about large amounts of sulfuric acid which take part in dissoluting carbonate rock.
The correlation coefficients of about Cl, Na, F and between Mg to HCO3 are more than 0.5, indicating that the rock salt and dolomite dissolving are the dominant groundwater evolution process in the GA group.
The first and second factor scores of deep fissure water in the GC group are the lowest in the coal mining district (Fig 8(a) and Fig 8(b)). The tritium was not detected and 14C contents were low in all deep fissure water samples, indicating the late Pleistocene rainfall recharging characteristic. Fig 9 (c) shows that there are good correlations about HCO3, Na, Ca, Mg, S18O and no correlations between Ca, Na in the GC group, indicating that the Ca2+, Na+ exchanging interaction play a key role, leading the balance equation of carbonate dissolving to increasing HCO3- direction pan. The correlation coefficients of about Mg2+, HCO3-, SO42-, F- are more than 0.5, indicating that sulfuric acid may take part in the dissolution action in the GD group (Fig 9 (d)).
The dominant anion and cation gradually become obvious along the X-axis direction in the GB group, indicating the groundwater mixing process.
5.3 Conceptual model
In the coal-mining exploring district, runoff recharging path of groundwater can be described by conceptual model (Fig 11). Shallow pore water to be contaminated in a certain range accepts surface water leakage recharging in the coal mining district. The deep karst water is mainly supplied from Mount Taihang. Deep fissure water accepted rainfall recharging in the late Pleistocene.
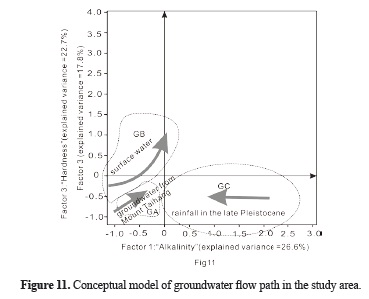
The shallow pore water to be contaminated in a certain range accepts surface water leakage recharging in the coal mining district. The deep karst water in coal mining district mainly originates from the recharge of groundwater from northern mountainous area. The deep fissure water a mainly originates from the recharge of rainfall in the late Pleistocene.
6 Conclusions
Coal mining has destroyed groundwater equilibrium states, so groundwater quality became worse and water inrush accident occurred more frequently. Based on mathematical statistical analysis theory, this paper studies groundwater isotope hydrogeochemical evolution in the coalmining exploring district to determine shallow pore water, deep fissure water and deep karst water recharging process and evolution mechanism in order to assess water quality and water inrush prevention providing scientific basis in the coal mining district.
7 Acknowledgements
The work was financially supported by science and technology key research project of Education Department of Chinese Henan province (No.13A170313,14A510022) and Technological Innovation Team of colleges and universities in Henan Province of China Grant 15IRTSTHN027.
8 References
Ashley, R.P. and Lloyd, J.W. (1978). An Example of the Use of Factor Analysis and Cluster Analysis in Groundwater Chemistry Interpretation. Journal of Hydrology, 39, 355-364. [ Links ]
Barbieri, M., Boschetti, T., Pettita, M. and Tallini, M. (2005). Stable Isotope (2H, 18O and 87Sr/86Sr) and Hydrochemistry Monitoring for Groundwater Hydrodynamics Analysis in a Karst Aquifer (Gran Sasso, Central Italy). Applied Geochemistry,20, 2063-2081. [ Links ]
Bengrai, K. and Marhaba, T.F. (2003). Using Principal Component Analysis to Monitor Spatial and Temporal Changes in Water Quality. Journal of Hazardous Materials B, 100, 179-195. [ Links ]
Brown, C.E. (1998). Applied Multivariate Statistics in Geohydrology and Related Sciences. Springer, New York. [ Links ]
Duan, Y. C., Hei, L. and Xie, G. X. (1994). Application of Environmental Isotopes in the Drain Test of Xingtai Mine (in Chinese). Coal Geology & Exploration, 22 (1), 33-37. [ Links ]
Farnham, M., Johannesson, K. H., Singh, A. K., Hodge, V.F. and Stetzenbach, K.J. (2003). 10-Factor Analytical Approaches for Evaluating Groundwater Trace Element Chemistry Data. Analytical Chimica Acta, 490, 123-138. [ Links ]
Farnham, M., Stetzenbach, K.J., Singh, A.K. and Johannesson, K.H. (2000). Deciphering Groundwater Flow Systems in Oasis valley, Nevada, Using Trace Element Chemistry, Multivariate Statistics, and Geographical Information System. Mathematical Geology, 32, 943-968. [ Links ]
Gui, H.R., Chen, L.W. and Song, X.M. (2005). Features of Oxygen and Hydrogen Stable Isotopes in Deep Groundwater in Mining Area of Northern Anhui. Journal of Harbin Institute of Technology, 37 (1), 111-114. [ Links ]
Harrington, G. A., Cook, P.G. and Herczeg, A.L. (2002). Spatial and Temporal Variability of Ground Water Recharge in Central Australia: A Tracer Approach. Ground Water, 40(5), 518-528. [ Links ]
Helena, B., Pardo, R., Vega, M., Barrado, E., Fernandez, J.M. and Fernandez, L. (2000). Temporal Evolution of Groundwater Composition in an Alluvial Aquifer (Pissuerga River, Spain) by Principal Component Analysis. Water Research, 34, 807-816. [ Links ]
Hernandez, M. A., Gonzalez, N. and Levin, M. (1991). Multivariate Analysis of a Coastal Phreatic Aquifer Using Hydrochemical and Isotopic Indicators, Buenos Aires, Argentina. Proceedings of the International Association on Water Pollution Research and Control's International Seminar on Pollution, Protection and Control of Groundwater: Water Science Technology, 24, 139-146. [ Links ]
Join, J.L., Coudray, J. and Longworth, K. (1997). Using Principal Components Analysis and Na/Cl Ratios to Trace Groundwater Circulation in a Volcanic Island: the Example of Reunion. Journal of Hydrology, 190 (1-2), 1-18. [ Links ]
Liedholz, T. and Schafmeister, M. T. (1998). Mapping of hydrochemical groundwater regimes by means of multivariate statistical analyses. In: Buccianti, A., Nardi, G., Potenza, R. (Eds.). Proceedings of the Fourth Annual Conference of the International Association for Mathematical Geology, October 5-9, Ischia, Italy. International Association for Mathematical Geology, Kingston, Ont. Canada, 298-303. [ Links ]
Lloyd, J.W. and Heathcoat, J.A. (1985). Natural Inorganic Chemistry in Relation to Ground Water. Clarendon Press, Oxford. [ Links ]
Long, A.J. and Putnam, L.D. (2004). Linear Model Describing Three Components of Flow in Karst Aquifers using 18O Data. Journal of Hydrology, 296, 254-270. [ Links ]
Marifia, A.M., Krishnamurthy, R.V., Atekwanna, E.A. and Panton, W.F. (2003). Isotopic and Geochemical Evolution of Ground and Surface Waters in a Karst Dominated Geological Setting: a Case Study from Belize, Central Otto M. Multivariate methods. Analytical Chemistry. Wileye-VCH, Weinheim. [ Links ]
Mckenna, J. R. (2003). An Enhanced Cluster Analysis Program with Bootstrap Significance Testing for Ecological Community Analysis. Environmental Modelling & Software, 18(3), 205-220. [ Links ]
Meng, S.X. and Maynard, J.B. (2001). Use of Multivariate Analysis to Formulate Conceptual Models of Geochemical behavior: Water Chemical Data from the Botucata Aquifer in Sao Paulo State, Brazil. Journal of Hydrology, 250, 78-97. [ Links ]
Otto, M. (1988). Fuzzy theory explained Chemometrics and Intelligent Laboratory Systems, 4(2), 101-120. [ Links ]
Ribeiro, L. and Macedo, M. E. (1995). Application of Multivariate Statistics, Trend and Cluster Analysis to Groundwater Quality in the Tejo and Sado aquifer. In: Groundwater Quality: Remediation and Protection. Proceedings of the Prague Conference, 225, 39-47. [ Links ]
Schot, P.P. and Wal, J. (1992). Human Impact on Regional Groundwater Composition through Intervention in Natural Flow Patterns and Changes in Land Use. Journal of Hydrology, 134, 297-313. [ Links ]
Seyhan, E., Van-de-Griend, A. A. and Engelen, G.B. (1985). Multivariate Analysis and Interpretation of the Hydrochemistry of Dolomitic Reef Aquifer, Northern Italy. Water Resources Research 21(7), 1010-1024. [ Links ]
Steinhorst, K.J., Hodge, V.F., Guo, C., Farnham, M. and Johannesson, K.H. (2001). Geochemical and Statistical Evidence of Deep Carbonate Groundwater within Averlying Volcanic Rock Aquifers/aquitards of Southern Nevada, USA. Journal of Hydrology, 243, 254-271. [ Links ]
Steinhorst, R.K. and Williams, R.E. (1985). Discrimination of Groundwater Sources Using Cluster Analysis, MANOVA, Canonical Analysis and Discriminant Analysis. Water Resources Research, 21, 1149-1156. [ Links ]
Steinhorst, K.J., Hodge, V.F. and Guo, C. (2001). Geochemical and Statistical Evidence of Deep Carbonate Groundwater within Overlying Volcanic Rock Aquifers/aquitards of Southern Nevada, USA. Journal of Hydrology, 243, 254-271. [ Links ]
Tao, S. (1998). Factor Score Mapping of Soil Trace Element Contents for the Shenzhen Area. Water, Air and Soil Pollution, 102, 415-425. [ Links ]
Wang, D.C., Zhang, R.Q. and Shi, Y.H. (1995). The Basis of Hydrogeology. Geological Publishing House, Beijing. [ Links ]
Wang, Y., Ma, T. and Luo, Z. (2001). Geostatistical and Geochemical Analysis of Surface Water Leakage into Groundwater on Regional Scale: a Case Study in the Liulin Karst System, Northwestern China. Journal of Hydrology, 246 (1-4), 223-234. [ Links ]
Welch, A.H. and Lico, M.S. (1998). Factors Controlling As and U in Shallow Groundwater, Southern Carson Desert, Nevada. Applied Geochemistry, 13, 521-539. [ Links ]

