


 Spanish (pdf)
 Article in xml format
 Article references
 Send this article by e-mail
 Cited by SciELO
  Cited by Google
  Similars in
SciELO
Similars in
SciELO  Similars in Google
 Permalink
Introduction
Maintenance of groundwater resource quality depends on the knowledge of how solutes move in the aquifer to estimate the groundwater contamination and therefore to manage the health risks. As the processes associated with the groundwater flow and solute transport are complexes, numerical modeling is a powerful tool to perform predictions and base the decision-making processes. Numerical models require input parameters that must be determined reliably to guarantee the quality of the prediction.
One of the main input parameters in the modeling of reactive solute transport is the retardation factor (Rd) (Fetter, 1999). Because of the physical, biological and chemical mechanisms involved between a liquid solution and particle surfaces of the soil, the velocity of water percolation, v, differs from the velocity of the solute, vs (Freeze and Cherry, 1979). The relationship between these two velocities is called retardation factor. When the solutes do not interact with the solid medium (are nonreactive), Rd = 1, the percolation velocity of the solute and the water are equal. Solutes with Rd > 1 are called reactive solutes (Freeze and Cherry, 1979; Shackelford, 1994). According to Jury, Gardner and Gardner (1991), retardation factors exceeding 3 indicate a high degree of solid particles-solute interaction and a very reactive solute.
The determination of the Rd can be performed based on the direct evaluation of the experimental breakthrough curves (BTCs) from column experiments (Freeze and Cherry, 1979; van Genuchten and Parker, 1984; Godoy, Gómez-Hernández and Zuquette, 2018). The Rd can also be determined using inverse modeling by fitting the advection-dispersion equation (ADE) to the experimental data (Ogata and Banks, 1961; Markhali and Ehteshami, 2016). Solute transport experiments can be performed using undisturbed soil cores (Vanderborght, Timmerman, and Feyen, 2000; Logsdon Keller and Moorman, 2002; Jarvis, 2007; Jellali et al., 2010), however, in a more general way, disturbed soils columns are used (Dousset et al., 2007; Eberemu, Amadi, and Edeh, 2013; Delwiche, Lehmann and Walter, 2014; Liu et al., 2014; Internó, Lenti and Fidelibus, 2015; Silva et al., 2016). Batch tests, despite their limitations, are also used to determine sorption isotherms and then Rd (Brigham, Reed and Dew, 1961; Fagundes and Zuquette, 2011; Fonseca et al., 2011; Barbieri et al., 2012; Liu et al., 2014; Arthur et al., 2017). Sorption isotherms are efficient in the Rd determination but their determination must consider the soil heterogeneity.
The characteristics of the Rd determination methods may affect its quantification. The use of an inadequate method to determine Rd values may cause under or overestimation of the fate and solute transport, impairing the design of clean-up techniques and health risk analyses. This is especially important by considering that those who work with numerical modeling usually use the provided parameters with no concerns about the method used in its determination.
Studies which aim to compare Rd determination methods are rare and this paper intends to contribute to reduce this lack (Shackelford, 1995; Porfiri et al., 2015) (3. Additionally, the use of undisturbed soil samples to perform solute transport test and determine sorption isotherm have not been identified in the literature, and are also presented in this work.
The objective of this study is twofold: (i) to compare four methods of Rd determination and (ii) to assess the impact of the chosen method in the prediction of sodium movement. In order to achieve that, first, the sodium Rd is experimentally determined using undisturbed sandy columns and then the Rd were determined based on the methods proposed by Freeze and Cherry (1979), by van Genuchten and Parker (1984), by the fit of the sorption isotherms models to the experimental data obtained from column experiments, and by fitting the analytical solution of the ADE to the experimental data. Second, the Rd obtained with all these methods were used as input parameter to reproduce the experimental BTC using the analytical solution of the ADE to evaluate the impact of a different Rd in the prediction of the sodium movement.
Data and methods
Soil sampling and characterization
The study was carried out in an experimental site located at the city of Cabrália Paulista (22°27'37" S, 49°20'16" W), State of São Paulo, Brazil. This area is constituted by the residual soil of sandstones from the Adamantina Formation, Bauru Group (K). The area was chosen because its geological materials are spread out at about 117,000 km2 in the state of São Paulo (Paula e Silva, Kiang, and Caetano-chang, 2003) and incorporate the Guaraní Aquifer System and some of its aquifer unities such as the Lower and Medium Bauru unities. The soil samples were taken from an area quite close to one where salty wastewater from domestic sewage has been used for irrigation purpose. Because of the high sodium (Na+) concentration in the wastewater, this was the solute used in this study.
We cautiously collected ten undisturbed samples from hand-excavated trenches using rigid PVC cylinders (150 mm length and 97.2 mm inner diameter). Undisturbed samples were used to conduct water flow and solute transport experiments in the laboratory and to analyze the soil porosity.
Porosity analysis by mercury intrusion (MIP) was performed in three samples (Washburn, 1921). MIP is based on the penetration of mercury into the soil pores, which occurs only under pressure since the mercury is a nonwetting fluid. The mercury penetration pressure should be higher the smaller the pore diameter, according to
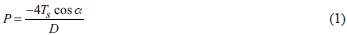
where Ts is the surface tension; a is the contact angle between the liquid and the surface of the solid; P is the applied pressure; and, D is the pore diameter. During the test, as the pressure is increased, the volumes of mercury inserted into the sample are monitored. Using Equation 1 the dV/dD differentials were obtained, which allowed obtaining the pore distribution of the sample. The apparatus used in these tests was the "Pore size 9320 - Micromeritics Instrument Corporation", with a maximum pressure of 30 000 psi.
Disturbed samples were taken to characterize, in three replicates, the physical, chemical, mineralogical and physicochemical properties of the soil (Godoy and Zuqutte, 2013). The mineralogical analysis was performed using X-ray diffraction(XRD) (Azaroff and Buerger, 1953), particle size analysis was performed according to ASTM D422-63. The density of the solids was determined according to ASTM D854-10. We also determined in three replicates the pH in H2O and in KCl, reduction potential (Eh), electrical conductivity (EC) (Donagema and Campos, 2011), delta pH (pHKCl - pHH2O) (Mekaru and Uehara, 1972), point of zero charge (PZC) (2pHKCl - pHH2O) (Keng and Uehara, 1974), and organic matter content according to ASTM D2974 - 00. The arithmetic mean of the three replicates was used as the value of the measured parameter. The methylene blue adsorption test using the filter paper method described by Pejon (1992) was used to determine CEC in one replicate from each soil sample.
In order to visually analyze the soil fabric characteristics as well as its capacity to retain solute, a solution of methylene blue (adsorbing dye) was percolated through the soil, a traditional method used to visualize flow pathways (Zehe and Flühler, 2001; Dousset et al., 2007). First, the filter paper was placed across the base of an unsaturated and undisturbed soil column, so that the preferential paths would be marked in the cross-sectional area of the column. Second, a volume of 1.5E-03 m3 of a methylene blue solution at a concentration of 3 kgm-3 was percolated through the soil. The soil was set aside to allow the excess solution to drain. Third, the soil sample was removed from the PVC cylinder and longitudinally cut to observe the methylene blue pathways and visually analyze the retention and the flow through the pores.
Column experiments
The PVC cylinders used for collecting the undisturbed soil samples were used as rigid-wall permeameters, in which column experiments were conducted. The soil columns were first slowly saturated from the bottom with distilled water to remove entrapped air. To ensure complete saturation, the distilled water was allowed to overflow 1 cm on the soil surface for two days. After column saturation, the flow was reversed, and the tests were performed under a constant hydraulic gradient of 1.5.
Once the steady-state condition was verified, that is, when flux (Q) variations were below 5% in a week, the following water flow parameters were obtained from each column: the saturated hydraulic conductivity, K (Darcy, 1856); Darcy velocity, q (Darcy, 1856)and average linear velocity, v (Freeze and Cherry, 1979). The mean effective porosity, ne, which is used in the calculation of v, was adopted as the percentage of pores larger than 10 µm based on the MIP results (Ahuja et al., 1984).
Three undisturbed soil columns were percolated with NaCl and the effluent was collected at each pore volume (Godoy, Zuquette and Napa García, 2015). The concentrations of the initial solution inserted in the columns 1, 2 and 3 were, respectively, 50, 90 and 117 mg.L-1 based on previous studies (Patterson, 1997; Medeiros et al., 2005; Silva et al., 2012). Solute displacement tests were carried out under isothermal (20 °C) conditions. The pH and electrical conductivity, both of the input solution and of the percolated effluent solution, were monitored throughout the test. The Na+ concentrations were determined in three replicates using a MICRONAL B26 flame photometer at a 1:21 dilution ratio. The column experiments design was also described by Godoy, Zuquette and Napa Garcia (2015).
Determination of retardation factors
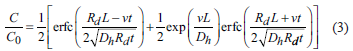
The Rd values were determined by four methods. First, Rd was determined inversely by fitting the analytical solution of the ADE (Ogata and Banks, 1961) to the experimental BTC,

where C is the concentration [ML-1], Dh is the longitudinal dispersion coefficient [L2T-1], v is the linear velocity of the fluid through a column [LT-1], and Rd is the retardation factor.
The analytical solution of the Equation 2 was proposed by Ogata and Banks (1961) and Lapidus and Amudson (1952) and was used to solve the ADE when the initial condition is C=0 for the entire sample, and the boundary conditions are C=C0 at the inlet and C=0 at an infinite distance from the inlet.
Second, Rd was determined using the method proposed by van Genuchten and Parker (1984) where the Rd is the area above the BTC; Third, the Rd determination was performed by using the method proposed by Freeze and Cherry (1979) where the Rd is equal to the pore volume when the relative concentration (C/C0) is 0.5; and Fourth, the Rd was found by fitting the sorption isotherms, obtained through column test, to the linear, Freundlich and Langmuir isotherm models (Freeze and Cherry, 1979; Garga and O'Shaughnessy, 1994; Fetter, 1999; Asgari et al., 2014). The ADE and the isotherms models' fits were performed using Mathematica 9.0. Table 1 shows the equations that were used to determine the Rd from different sorption isotherms.
Table 1 Equations used to determine Rd from sorption isotherms

Where n represents the porosity [ ]; k is the Henry coefficient for linear isotherm [ ]; bl is the Freundlich coefficient [ML-3(-b2)-1]; b2 is the Freundlich exponent [ ]; kl is the Langmuir sorption coefficient[]; k2 is an exponential coefficient [L3M-1]; Ce is the equilibrium concentration [ML-3].
Lastly, the Rd obtained with the aforementioned methods were directly used to predict the experimental BTC using the analytical solution of the ADE. The coefficient of determination R2 was computed and used to assess the goodness of the Rd to explain the experimental data. The simulated BTCs were used to assess the impact of the Rd determination method in the sodium movement prediction.
Results and discussion
Soil characterization and flow parameters
Texturally, the soil is clayey silty sand and consists of 79.4% sand, 10.5% clay and 10.1% silt particles. The specific weight of the solids was consistent with sandy soil values (26.4 kNm-³). The main minerals are quartz, kaolinite, and gibbsite and the results of the XRD are showed in Figure 1.
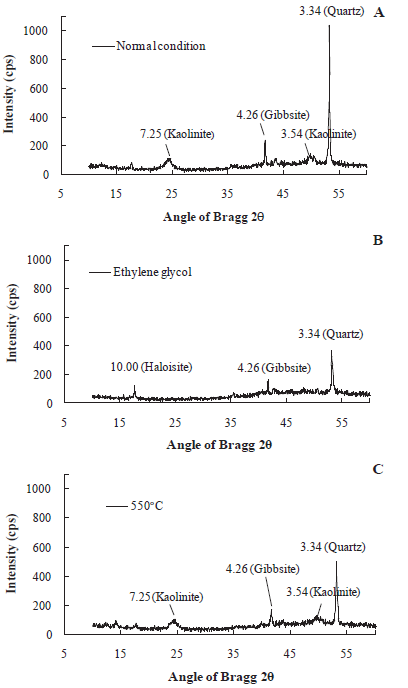
Figure 1 XRD diffractograms of the studied soil soil: A normal condition; B Ethylene glycol; C 550’C֯
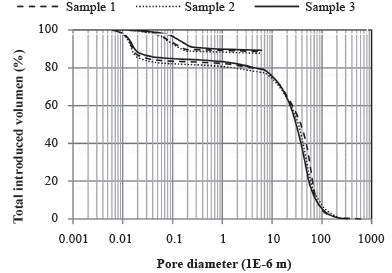
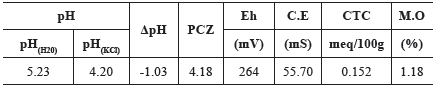
Table 2 summarizes the soil physicochemical parameters. The soil presented values of 5.23 and 4.20 for pH in H2O and in KCl, respectively, and contains a small amount of organic matter (1.18%). With these results, it is possible to note that there was an indication of the electrostatic adsorption due to the negative delta pH (-1.03) and PZC lower than the pHH2O (4.18).
According to the MIP, the distribution of pore sizes is: 5% macropores, 50% mesopores and 45% micropores (Koorevaar, Menelik and Dirksen, 1983). According to Godoy (2015), the soil also contains macropores larger than 100 that cannot be identified in the porosimetry analysis due to characteristics of the test. These pores are up to 4 mm in diameter and were presumably important in determining the movement of the sodium in the soil.
Table 3 shows the flow parameters obtained from column experiments. The average K coefficient is in the typical range of sandy soils (Zuquette and Palma, 2006). The mean v can be considered high, most probably due to the presence of preferential pathways caused by macropores (McMahon and Thomas, 1974; Dousset et al., 2007; Delwiche, Lehmann and Walter, 2014; Silva et al., 2016).
Table 3 Flow parameters obtained from column experiments
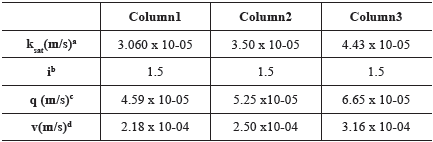
a: saturated hydraulic conductivity; b: hydraulic gradient; c: Darcy velocity; d: average linear velocity
Analysis of breakthrough curves
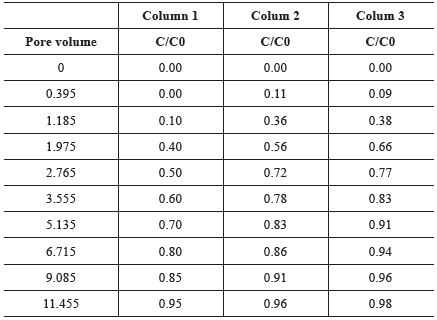
Figure 3 shows the BTCs of the Na+ plotted using the relative concentration measured in the leachate (C/C0) vs. the number of eluted pore volumes and Table 4 summarizes the results obtained from column experiments. With the increase of the initial concentration there is a displacement of the BTC to the left, indicating that the higher the concentration of the initial solution, the faster the solute is identified in the effluent solution. This can be related to the limited sorption sites in the soil as well as to the soil physical heterogeneities.
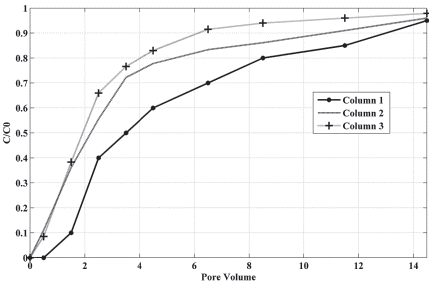
The BTCs have the appearance of a continuous flow of initial solution. The tails show that in the beginning, the solute speedily left the soil column and after that, there was a slow transport and a significant tailing occurred. This can indicates physical nonequilibrium and the presence of heterogeneous adsorption sites in the soil, caused by small-scale heterogeneity (Gerritse, 1996; Vanderborght, Timmerman and Feyen, 2000; Dousset et al., 2007; Jarvis, 2007).
The small-scale heterogeneity may be due to the dual-porosity characteristic of the soil. The dual-porosity affects the timing and shape of the BTC as mentioned by Rezanezhad et al. (2012). That occurs because part of the solutes can move fast due to advection in large pores and part of them can be trapped in immobile regions due to percolation through micropores and non-interconnected pores, behavior also stated by others (van Genuchten and Wierenga, 1976; Jarvis, 2007; Silva et al., 2016).
Visual analysis of the dye transport
The visual analysis of the dye transport pathways indicated that, although the methylene blue solution was equally distributed in the upper part of the column, there was a greater flow in one location than in the rest of the column and it is evident in Figure 4 which shows the location where preferential flow occurred (labeled in the photo).
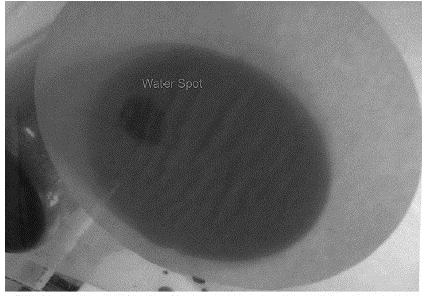
As only water was observed in the effluent, the methylene blue is believed to have been subject to physical retardation in macropores, which do not connect to the bottom of the soil sample (Figure 5), and chemical retardation due to the soil and solute chemical characteristics.
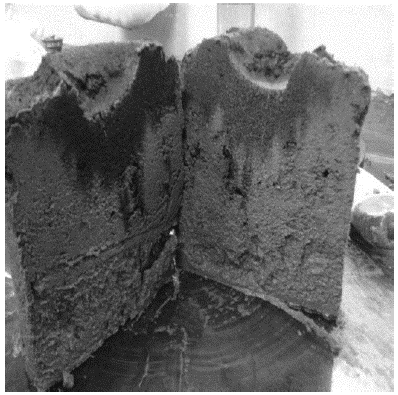
Figure 5 Visual analysis of the dye transport pathways: retardation in connected macropores that are not connected to the bottom of the soil sample
A similar result was found by Dousset et al. (2007) who verified physical retardation of a dye tracer in non-connected pores. Even after introducing three pore volumes of the solution, the methylene blue remained in the surface portion of the column. The retention of methylene blue indicates that the soil has very significant cation sorption, contrary to what is expected for sandy soils since the mineralogy of these soils is not composed by reactive clay minerals.
Sodium sorption isotherm
The sodium sorption isotherm is shown in Figure 6. There is an increase in sorption over time and saturation is reached when no additional sorption of Na+ occurs. Different results were obtained by Müller (2005) and Humenick and Mattox (1978). The maximum Na+ sorption value (0.1 gg-1) did not exceed the maximum soil sorption (0.5 gg-1) obtained by the CEC analysis. Thus, the sorption values probably are primarily related to physical mechanisms such as retention in micropores which represent 45% of the total porosity. With this result, it is possible to suppose that chemical and electrical mechanisms were probably of minor importance in the Na+ retardation. It is important to mention that four points may not be sufficient to define the isotherm accurately but can show the trend of the sorption behavior as obtained by Önal et al. (2007).
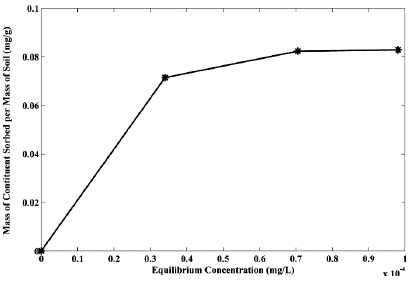
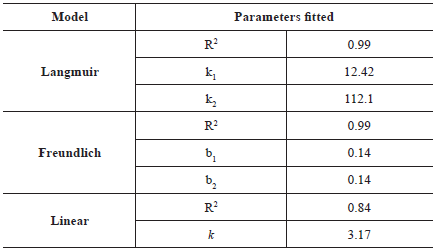
Table 5 presents the fit of the experimental data to the mathematical models of the Langmuir, Freundlich, and linear isotherms. The Langmuir and Freundlich models fitted well to the experimental data (R2 = 0.99). According to Önal et al. (2007), the Langmuir model can be successfully applied to many real sorption processes. The linear model had the worst fit (R2 = 0.84) indicating the nonlinearity of the experimental isotherm.
Retardation factor and its impact on the sodium movement prediction
In this section, the Rd values obtained with different methods are shown and discussed. Table 6 shows the retardation factors obtained using the methods proposed by Freeze and Cherry (1979), van Genuchten and Parker (1984), Ogata and Banks (1691) and by the fit of the sorption isotherms.
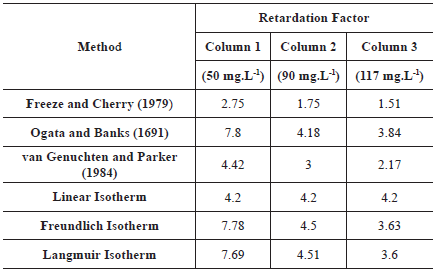
The Rd values can be considered very high, except for the one obtained with the Freeze and Cherry (1979) method (Jury, Gardner, and Gardner, 1991). Rd values were higher even when compared to results obtained in compacted kaolin at low flow rates, which has a high retardation factor since they are used as liners (Shackelford and Redmond, 1995). Using the linear isotherm model, Garga and O'Shaughnessy (1994) found sodium retardation factor ranging from 2.22 to 3.6 in clay soil columns with high CEC. The high values of Rd obtained are in accordance with the results obtained with the sorption isotherm and with the dye transport. The sorption isotherm yields values of Rd smaller than those obtained by the CEC from the blue methylene adsorption test suggesting a physical dependence originated by e.g. preferential pathways which were also evidenced in the dye transport pathway.
Given that high average linear velocity values were observed during the experiments (Table 3), small values of Rd can be expected because of the reduction of the contact time between the solute and soil particles, as observed by Hoag and Price (1997). The soil sorption and physical-chemical characteristics did not indicate that Rd values would be high. However, the physical characteristics played a key role in the Rd quantification, as was also noticed by Rezanezhad et al. (2012).
There is a trend to decrease Rd with increasing initial concentration. This behavior is in accordance with the limited sorption sites in the soil but could also reflects soil heterogeneities between the columns, since they are natural soil cores and do not have the same pore configuration, as observed by Dousset et al. (2007).
The coefficients of determination (R2) of the prediction of the BTC using the analytical solution of the ADE are shown in Table 7. Figure 7 shows the fit of the experimental BTC to the analytical equation using Rd obtained with the methods used in this study.
Table 7 The coefficient of determination (R2) of the prediction of the BTC using the analytical solution of the ADE
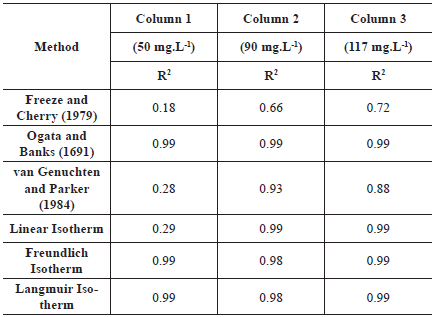
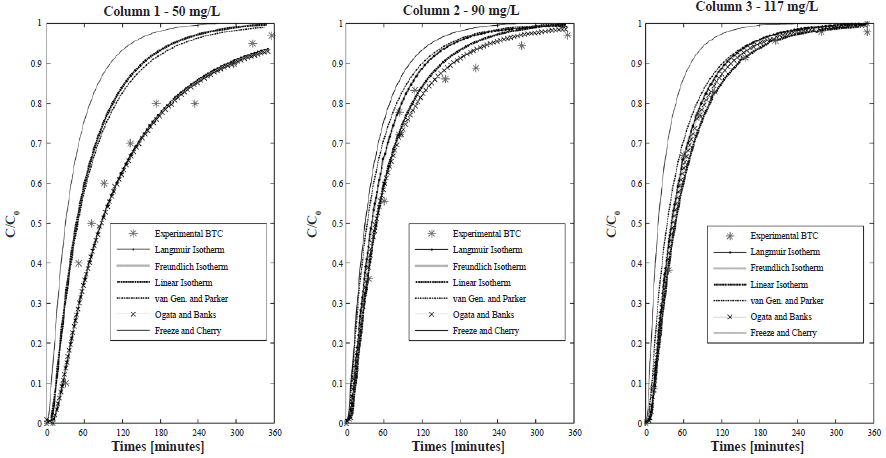
Figure 7 Fit of the experimental BTC to the analytical solution of the ADE using Rd obtained with all the methods used in this study work
In Figure 7, it can be observed that the higher the Rd, the slower the movement and the BTC displace to the left, as mentioned by other authors (Freeze and Cherry, 1979; Shackelford, 1991; Malusis and Shackelford, 2002).
The Rd values obtained with the method of Freeze and Cherry (1979) were the smallest. This method can be suitable for soils with no preferential pathways, but when there is a dual-porosity, part of the solute will appear faster in the effluent solution, and part will be retained in micropores (Rezanezhad et al., 2012). Thereby, half of the initial concentration (C/C0) = 0.5, can be detected too fast in the effluent solution, not representing the solute that still is retained and that is also very important in the determination of the correct Rd. According to Shakelford (1994), this method can be adequate when pure advection occurs, i.e., without dispersion/diffusion. It is suitable when high ( > 50) Péclet numbers are achieved (only advection) but is not appropriate when there is dispersion. Moreover, this method is based on the sigmoidal BTC of homogeneous soils, which was not observed in the results. Therefore, this method is not adequate to determine the retardation factor of the sodium in the studied soil. The method of Freeze and Cherry (1979) also overestimated Na+ movement prediction once the fitted BTC is displaced to the left in comparison to the experimental curve (Figure 7). The R2 obtained with this method were the smallest but increased with increasing concentration of the initial solution.
The method proposed by Ogata and Banks (1961) resulted in higher Rd values for all columns. This method is suitable for homogeneous soils, with linear sorption, characteristics not suitable for the studied soil. However, the R2 was 0.99 for all initial concentrations, indicating that the ADE model explained the experimental BTC. Therefore, it is possible that the ADE can be adequate to reproduce BTC in heterogeneous materials for small-scale studies, in which the macrodispersion has no place.
The method proposed by van Genuchten and Parker (1984), besides being based on the Ogata and Banks (1691) transport equation, considers the mass balance of the solute in the soil and can so be capable of capturing the mass of solute retained in the soil regardless of whether there is equilibrium or nonequilibrium transport. The relatively good suitability of this method was verified with R2 ranging from 0.78 to 0.91. However, in Figure 7 it is noticeable that the sodium movement is overestimated. It is important to mention that the correct use of this method depends on whether the solute had reached inflow concentration, which can sometimes take a long time. In this research, the inflow concentration was not reached in any column test and to use this method, an extrapolation was made, which can explain the errors in the Na+ movement prediction.
For column 1, the use of the R obtained with the linear isotherm model is not adequate for the prediction of the Na+, since the movement is overestimated and R2 was small (0.29). These results are adequate with the fact that the soil isotherm is nonlinear and that the soil has a limited sorption capacity, which is not represented by the linear model. However, for columns 2 and 3, this model seems to be suitable with R2 equal to 0.99. This method should be used with caution since its suitability depends on the concentration of the initial solution. The results obtained with the other two isotherm models, Langmuir and Freundlich, were quite similar and, in comparison to the experimental BTC, the simulated curves using those methods reproduced very well the experimental BTC with R2 equal to 0.99 for both isotherms. These results show the efficiency of the use of isotherms obtained from undisturbed soil columns to determine Rd.
The comparison of the simulated BTC evidenced the impact of the method used to calculate de Rd in the sodium movement prediction and this impact is more pronounced with the decrease in the initial concentration of the inlet solution. The R2 increased with the increase of the initial concentration for almost all conditions studied. It is possible that, for a low concentration of the initial solution, the equilibrium adsorption has not yet been reached and the Rd determination could be more difficult to achieve. By increasing the concentration of the initial solution, the Rd determination is more stable and almost all methods work relatively well.
Table 8 shows the comparison between Na+ concentrations obtained experimentally and after 180 minutes using different methods of Rd determination in the analytical solution of the ADE.
Table 8 Comparison between sodium concentrations obtained experimentally and after 180 minutes using a different method of Rd determination in the analytical solution of the ADE
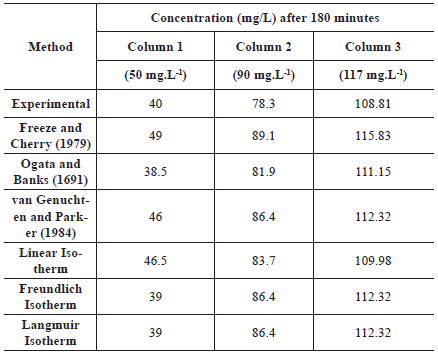
From Table 8 it is noticeable that for column 1, the predicted concentration using the Rd calculated with the method of Ogata and Banks (1961) was 3.75 % smaller compared to the experimental data; with the Langmuir and Freundlich isotherms, it was 2.5 % smaller. The linear isotherm, Freeze and Cherry's and van Genuchten and Parker's methods overestimated the concentration in 16.25%, 22.5 %, and 15%, respectively.
For column 2 and 3, all concentrations were overestimated, but this effect was smaller when compared to the results of column 1. For column 2, the overestimation of the concentrations was 4.5 % when using the method of Ogata and Banks, 13.80% for the method proposed by Freeze and Cherry, 10.34% for the methods of van Genuchten and Parker and the Langmuir and Freundlich isotherms, and 6.8 % for the linear isotherm. For column 3, the increase in the prediction of the concentration ranged from 1 % to 6%, and the worst method was the one proposed by Freeze and Cherry. For all columns, the highest overestimated percentage was obtained using the method proposed by Freeze and Cherry, as expected since this method resulted in the smallest Rd due to its characteristics as discussed above.
Conclusion
Aiming to compare four methods of sodium Rd determination and assess the impact of the chosen method in the prediction of sodium movement, we did laboratory tests and used the analytical solution of the ADE to perform solute transport predictions. With the presented study, it was possible to highlight some conclusions. In columns containing natural and completely weathered soils, with preferential paths and dual-porosity, the solute transport parameters obtained using some of the most common methods found in the literature may result in non-representative Rd values mainly due to the natural heterogeneity of the soil column. The suitability of the method used for determining Rd depended on the concentration of the initial solution. The higher the initial concentration, the smaller the errors in the prediction of sodium movement. For the conditions studied, the method proposed by Ogata and Banks (1961) and by the fit of the Freundlich and Langmuir isotherms models resulted in the best reproduction of the experimental breakthrough curve. Differently, the method proposed by Freeze and Cherry (1979) resulted in the worst result. The fit of the experimental BTC to the ADE analytical models showed that the predicted concentration can be overestimated up to 22.5% when using a not suitable method. With this study, we conclude that the Rd determination method can significantly affect the prediction of the sodium movement. Because of that, it is important to evaluate carefully when a method can be adequate to determine the Rd for the soil under investigation and when cannot be adequate.

