


 English (pdf)
 Article in xml format
 Article references
 Send this article by e-mail
 Cited by SciELO
  Cited by Google
  Similars in
SciELO
Similars in
SciELO  Similars in Google
 Permalink
Introduction
According to several studies, linear statistical methods are insufficient for a complete analysis of meteorological parameters time series. Researchers have explained these findings by the fact that the atmosphere and the natural processes taking place in it are a complex natural system (Kantz and Schreiber, 2004; Peters and Neelin, 2006; Vassoler and Zebende, 2012; Shi, 2014). Therefore, meteorological parameters are characterized by a high degree of nonlinearity, non-stationarity and complexity (He, 2015; Agbazo et al., 2019a; Philippopoulos et al., 2019; Kalamaras et al., 2017, 2019; Jiang et al., 2016; Burgueño et al., 2014 and Dong et al., 2016). In this context, multifractal methods are suitable to analyze processes that obey to nonlinearity characteristics. Nowadays, the Multifractal Detrended Fluctuation Analysis (MFDFA) introduced by Kantelhardt et al. (Kantelhardt et al., 2002) has been used widely to examine the intrinsic behavior of meteorological parameters in order to explain climate change, to assess climate change impact by improved methods and to do their prediction (Kalamaras et al., 2019). For example, recently, MFDFA has been applied to time series of: precipitation by Efstathiou and Varotsos (2012); Agbazo et al. (2019a); temperature by Kalamaras et al. (2017); Kalamaras et al. (2019); Jiang et al. (2016); Burgueño et al. (2014); Dong et al. (2016); wind speed by Kavasseri and Nagarajan (2005); Feng et al. (2009), and many others. The authors found that MFDFA methods can help reveal some properties, which could not be detected by linear methods (Kantelhardt et al., 2002; Kalamaras et al., 2017, 2019; Philippopoulos et al., 2019; Jiang et al., 2016).
Variations in temperature and precipitations' records are important indicators of climate change (Jiang, 2017). Agbazo et al. (2019a) have studied the fractal analysis of the long-term memory in precipitation in Benin (West Africa). They have shown, (i) the existence of positive long-term memory characteristic in the rainfall of area and found that (ii) fractal theory reveals Benin climatic characteristics better. Therefore, in order to generalise the differences in the dynamics of meteorological processes and to assess climate impacts, it is important to compare multifractal properties of temperature in various climate conditions. However, long-term memory of temperature has not yet been studied in a fractal framework in Benin, one of the West African countries affected by the effects of climate change (IPCC, 2007). Thus, the aim of this work is to analyse spatial and time variation of multifractal properties of daily temperature time series observed in Benin synoptic stations in order to examine the basic features of their multifractal behavior.
Materials and Methods
Site Description
The study covers all the synoptic stations of Benin (Figure 1), the geographical positions of which are presented in Table 1 below. According to Boko et al. (1988), Benin is characterized from the South to the North by two main climatic zones in which synoptic stations are located: Cotonou, Bohicon, and Save are located in the subequatorial region where March is the hottest month (~26°C), while August is the coldest month (~24°C). The daily and annual thermal amplitudes are, respectively, ~10°C and ~5°C. The relative humidity ranges between 70% and 95% because of the proximity to the Atlantic Ocean. The subequatorial climate has four seasons in a year: a long rainy season (April to July) followed by a short dry season (August to September) and a short rainy season (October to November) followed by long dry season (December to March). However, the stations of Parakou, Kandi, and Natitingou are located in Sudanian region in the northern part of the country. The daily mean of air temperatures in Natitingou, Parakou, and Kandi are, respectively, ~25°C, ~27°C, and ~35°C.
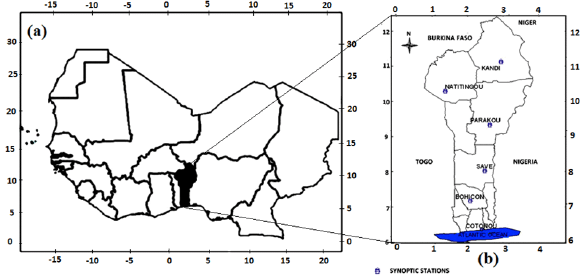
Figure 1 Study sites location: (a) Benin's location in West Africa, (b) Synoptic stations' location in Benin.
Data Records
Data were provided by the Agency for Aerial Navigation Safety in Africa and Madagascar (ASECNA). Daily temperature data from Benin synoptic stations: Cotonou (Co), Bohicon (Bo), Save (Sa), Parakou (Pa), Kandi (Ka) and Natitingou (Na) are used for the period from 1967 to 2012. Figure 2 shows the mustache boxes of temperature.
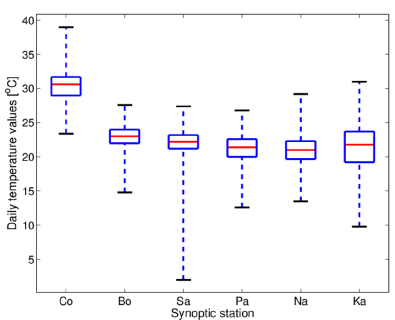
Figure 2 Mustache boxes of temperature data observed at each synoptic station from 1967 to 2012. Cotonou (Co), Bohicon (Bo), Save (Sa), Parakou (Pa), Kandi (Ka) and Natitingou (Na).
The figure shows that the smallest and largest values of minimum temperature are observed respectively in Save (~ 3°C) and Cotonou (~ 39°C). While, the smallest and largest values of maximum temperature are observed respectively in Parakou and Cotonou. The temperature distribution is asymmetrical.
Methods
Description of MFDFA Method
To investigate multifractal characteristics of non-stationary, non-linear, natural and complex meteorological phenomenon time series (Shen et al., 2015, 2017; Wan et al., 2016; Jiang et al., 2017), the MFDFA method was proposed by Kantelhardt et al. (2002). It can be briefly described according to Shen et al. (2017), as followed:
Let {x t \t = 1,2,..., N} bean original time series of N equidistant measurements to which the procedure of the MFDFA method is applied. First, a new series named "profile" is determined as followed:
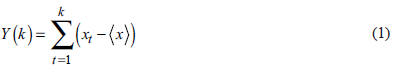
Where 〈x〉 is the mean value of x t and k = 1, 2, ..., N.
The profile is then divided into N = int(N/s) equal-sized nonoverlapping windows with a length s. Since N is not the integral multiple of s in most cases, there might be a short part at the end of the profile that remains uncovered. To take full account of the series, the same procedure can be repeated starting from the end of the series. Hence, we obtain 2Ns segments altogether. We then calculate the variance of each window as follows:
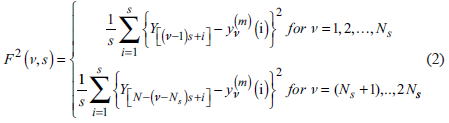
It should be noted that linear (i.e., polynomial order m=1), quadratic (i.e., m=2), cubic (i.e., m=3), or higher-order polynomials
 can be used to fit the local trend. In MFDFAm, possible m order trends are eliminated in the profile. The order of the polynomial has been found not to alter the results, with the order varying from 2 to 5 (Koscielny-Bundea et al., 2006). In this study, a third-order polynomial has been adopted as shown by Agbazo et al. (2019a) in Benin for the precipitation time series.
By averaging over all windows, we obtain the fluctuation as follows:
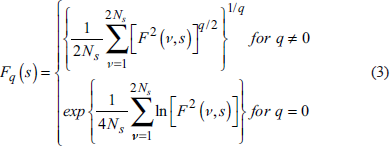
If the time series follow the power law, then we can obtain the scaling function:

Where h(q) is the generalized Hurst scaling function (Kantelhardt et al., 2002; Telesca et al., 2004). For monofractal time series, h(q) is independent of q, whereas, for a multifractal time series, h(q) varies with q. To be specific, the scaling exponent h(2) provides information about the average fluctuation of the series. The series can be categorized into one of the following three types depending on the h(2) values. These are: (i) 0 < h(2) < 0.5 for an anti-persistent type long range correlated process (negative long-term memory) where large values (compared to the average) are more likely followed by small values and vice versa, (ii) h(2) = 0.5 for an entirely random uncorrelated distribution, and (iii) 0.5 < h(2) < 1 for a persistent and long range correlated process (positive long-term memory) where large values are more likely to be followed by large values and vice versa. As Király and Jánosi (2005) suggest, the term "persistent" is used in the sense that an increasing trend in the past implies an increasing trend in the future. Thus, it lightly differs from "persistence" in climatology, defined as the continuance of a specific pattern. This dependence is considered to be a characteristic of multifractal process (Kantelhardt et al., 2002). In order to avoid a divergence of moments in the fat tails of the fluctuation distribution as mentioned by some authors (Wang et al., 2013; Ihlen et al., 2012), we restrict the order q within the range -5 ≤ q ≤ 5 as in (Wang et al., 2013).
Multifractal Spectrum
In order to get more information about the temperature data and to characterize the strength ofthe multifractality, two functions and few parameters are deduced from h(q) via a Legendre transform (Feder et al.,1988; Kantelhardt et al., 2002; Shi et al., 2008; Liu et al., 2014a, 2015; Jiang et al., 2016). These functions are defined by following equations:
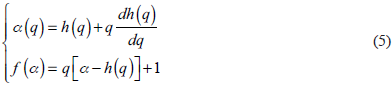
α (q) and f (α) are respectively singularity strength (or Holder exponent) and multifractal spectrum.
These parameters are defined as followed:

And

Where α max and α min are obtained from the relation f (α) = 0.

If the observed time series is a single-scale fractal series, the function f(α) is a constant. f(α) Generally, if the time series is a multiscale series, the function has a bell-like shape. The first important property of the spectrum is its width. ∆α is multifractal spectrum width or spectrum width. The parameter ∆α describes the inhomogeneity of the distribution of probability measured on the overall fractal structure, which has been identified as the intermittency and degree of multifractality (Liu et al., 2014a). The smaller ∆α is, the more uniformly distributed the fractal region is; while, the bigger ∆α is, the more heterogeneous the probability distribution is. In others words, if a spectrum has a broad width, ∆α is indicative of a strong multifractality (i.e., it has a 'fine' structure). If the width becomes smaller, then the time series tends to be a monofractal one. The spectrum width of a pure monofractal time series is equal to zero. ∆f>0 shows that the number of largest subsets is greater than the minimal one in probability measures, so, multiscale fractal spectrum shows a "left hook" shape; ∆f>0 shows a contrary condition, and the multiscale fractal spectrum is "right hook" shaped. Designing α0 as the singularity strength with maximum spectrum, a small value of α0 means that the underlying process "loses fine-structure"; while a large value of α0 ensures larger complexity.
According to Shimizu et al. (2006), a measure of the width of the multifractal spectrum can be obtained by fitting a second-order equation to the curve of the spectrum around α0

Among the three constants A, B, C, the most important is B, which is an asymmetry parameter. Coefficient B indicates the asymmetry of the spectrum. According to Burgueño et al. (2014) and Kalamaras et al. (2019), when B being zero for a symmetric spectrum, the shape of the spectrum is symmetrical. For positive B values, the spectrum is right-skewed and for negative left-skewed (Burgueño et al., 2014). A right-skewed spectrum is related to relatively strongly weighted high fractal exponents (with "fine-structure"), while a left-skewed spectrum is indicative of low fractal exponents (a more 'regular' time series). C is an additive constant equal to 1.
Origins of Multifractality
Generally, there are two major types of sources for multifractality in time series: (a) different temporal correlations for small and large fluctuations and (b) a fat-tailed probability distribution for the values of the time series (Rak and Zieba 2015). The main methods to find the contributions of the two sources of multifractality are the shuffling procedure and the surrogating procedure, respectively (Kwapien et al., 2005). Indeed, to test the first source of multifractality, we randomly shuffle the series to remove any temporal correlations. Thus, if no multifractal feature remains after we conduct the shuffling procedure on the original multifractal series, we can conclude that long-range correlation dominates the multifractality in the original series. The shuffling procedure consists in generating a random permutation of the array elements of time series. In contrast, surrogate data is used to check whether the multifractality comes from fat-tailed probability distribution, because it can eliminate any sort of non-linearities in original series and weaken the non-Gaussianity of the distributions. In this paper, we use the common method of Amplitude Adjusted Fourier Transform (AAFT) developed in (Theiler et al., 1992; Dong et al., 2016; Wu et al., 2018) to obtain surrogate data. AAFT can be summarized according to Dong et al. (2016) as follows: 1) a discrete Fourier transform of the original series is conducted, 2) the discrete Fourier transform of the data is multiplied by random phases, and 3) an inverse Fourier transform is performed to generate a phase-randomized surrogate. To further compare the contributions of multifractality from the two sources, the corresponding multifractal spectrum width is computed for the original series, shuffled series and surrogate series. To better compare the impact of both types ofmultifractality in time, the following computations are done: (1) the ratio to ∆α, which can reflect the contribution of the long-range correlations' multifractal strength to the whole multifractal strength (Shen et al., 2016); (2) the ratio ∆α shuf to ∆α, which indicates the proportion of the fat-tailed probability distribution multifractality.
Results and Discussion
The fluctuation function log (F q (s)) versus log (s) of the original temperature time series is plotted for different statistical moments q= (-5, -2, 2, 5) and shown in Figure 3.
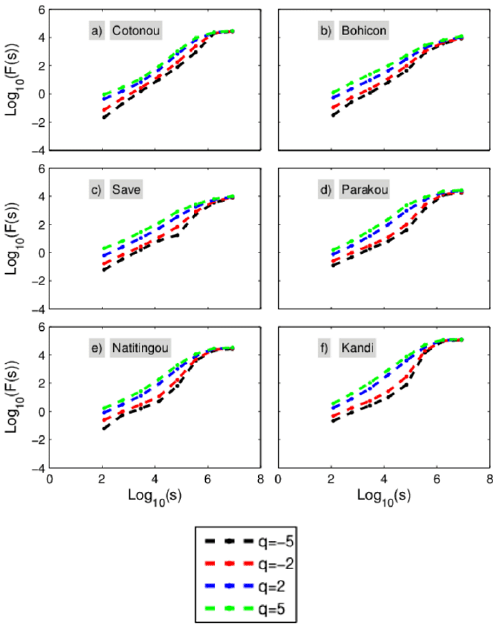
Figure 3 Log-log plots of the MFDFA fluctuation factor F q (s) versus the time scale s for specific moments q for the temperature time series observed at (a) Cotonou, (b) Bohicon, (c) Save, (d) Parakou, (e) Natitingou and (f) Kandi synoptic stations.
It is observed that the linear relationship between the MFDFA fluctuation factor F q (s) and the time scale s is obvious, which implies the existence of power-law relationship. In addition, a phenomenon appears in some of the relationships shown in Figure 3: the regression lines with different orders of q tend to converge, which indicates the multifractal nature of the original series of temperature records. Moreover, the scaling behavior of F q (s) (i.e. slope) for positive and negative q are not the same at each synoptic station. This behavior reveals the existence of different degrees of multifractality at Benin synoptic stations.
In order to verify if these apparently converging lines are multifractal or monofractal, the plot of the generalized Hurst exponent h(q) versus q obtained at each synoptic station for original temperature times series are shown in Figure 4.
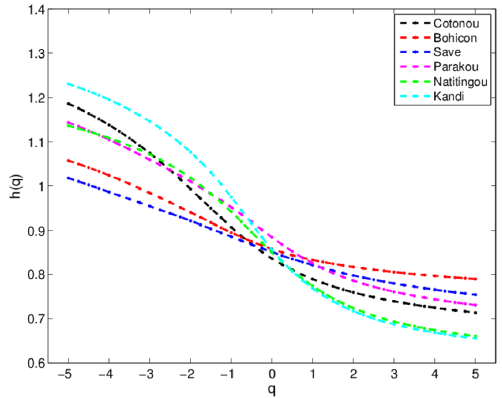
Figure 4 Generalized Hurst exponent h(q) as a function of q for the original temperature at all synoptic stations
To further compare the contributions of multifractality from the two sources, the corresponding multifractal spectrum f(α) is computed. In Figure 5 the multifractal spectrum is presented as a function of the singularity strength α for the original series, shuffled series and surrogate series.
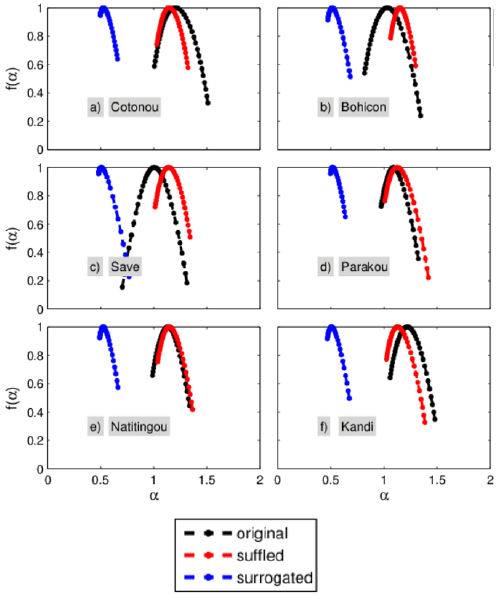
Figure 5 Singularity spectrum f(α) as a function of the singularity strength function a for the temperature of original, shuffled and surrogated series at (α) Cotonou, (b) Bohicon, (c) Save, (d) Parakou, (e) Natitingou and (f) Kandi synoptic stations.
It is observed that multifractal behavior for temperature at each synoptic station is clearly shown in Figure 4 because all the curves have obvious negative slopes. To be specific, all the h(2) values are greater than 0.5. One can conclude that the original temperature series is nonstationary signals with long range power-law correlations (Shi, 2014). Therefore, the fluctuations of the temperature time series are positively correlated in a power-law fashion.
In all cases, the spectrum shape is a humped curve and it is obviously unsymmetrical about its axis. Moreover, the spectrum has a left truncation and a long right tail. This is attributed to multifractal structure that is insensitive to the local fluctuations with large magnitudes.
The South-North distributions of the main multifractal parameters are presented in Figure 6.
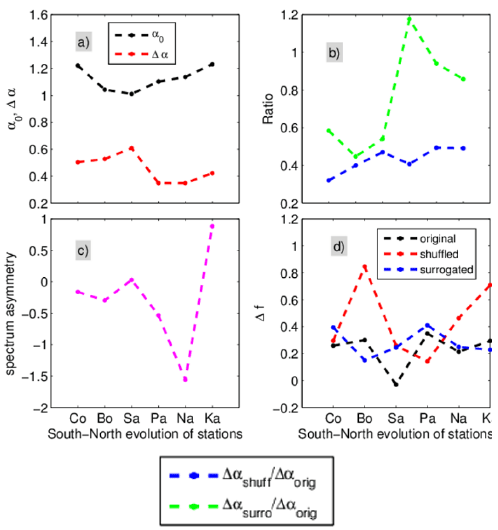
Figure 6 South-North distribution of the main multifractal parameters obtained for the original, shuffled and surrogate temperature times series. (α) α0 and the spectrum width, ∆α; (b) the ratio ∆α surrogated to ∆α original and the ratio shuffled to ∆α original ; (c) spectrum asymmetry and (d) ∆f values.
It is observed in Figure 6a that except Cotonou and Bohicon stations, a 0 values increase with the station's latitude. However, highest and lowest values are respectively observed at Cotonou and Save stations, which implies that the underlying mechanism governing daily temperatures has larger complexity at Cotonou than Save.
Figure 6a reveals that spectrum width Aa increases with the latitude in subequatorial and Sudanian regions. However, Aa values in the subequatorial region are systematically greater than those of Sudanian region. These findings indicate that in Sudanian region the fractal range is more uniformly distributed; while in subequatorial region the probability distribution is more heterogeneous. In others words, the multifractality is stronger in subequatorial region. The highest value of ∆α is obtained at Parakou station, which implies a stochastic dynamic character and strong fluctuations of the original series at this station as compared to the others (Xue et al., 2015).
The ratio ∆α surr to ∆α, and ratio ∆α shuf to ∆α are presented in Figure 6b. It is shown that no gradient is obvious in their South-North distribution. It is clearly observed that, whatever the station, the contribution of the long-range correlations' multifractal strength to the whole multifractal strength is systematically greater than the proportion of the fat-tailed probability distribution multifractality. It can be noticed that Parakou temperature series have the highest value of the ratio ∆α surr to ∆α among all the Benin synoptic stations.
Regarding the spectral asymmetry spatial distribution (Figure 6c), it is observed that except Kandi, the spectrum asymmetry values are negative; therefore, the spectrum is left-skewed, which is indicative of low fractal exponents (a more 'regular' time series). Kandi's spectra are with higher spectrum asymmetry values, therefore, contain a greater number of high fractal components.
As shown in Figure 6d, ∆f > 0 for the original, shuffled and surrogate temperature times series over all synoptic stations. These findings show that the number of largest subsets is greater than the minimal one in probability measures, so, multiscale fractal spectrum shows a "left hook" shape. However, ∆f values are systematically different for original, shuffled and surrogate temperature times series. Therefore, the source of multifractality in temperature depends on long-range temporal correlations and a fat-tailed probability distribution. However, both of them influence the multifractality. Moreover, the multifractality in temperature depends on the geographical position and the type of climate of the studied station. The value of ∆f is not systematically reduced after the original series is shuffled and surrogated. Therefore, the shuffling and the surrogating procedure do not systematically imply the reduction in the degree of multifractality.
Conclusions
In this paper, the multifractal behavior of daily temperature time series for Benin synoptic stations from 1967 to 2012 is investigated by Multifractal Detrended Fluctuation Analysis (MFDFA) method. This is achieved through five multifractal parameters (Hurst exponent, Holder exponent with maximum spectrum, spectrum asymmetry, spectrum width and singularity spectrum). The main and nontrivial findings obtained are the following:
Temperature time series exhibit long-range temporal correlation, which cannot be fully described by a single scaling exponent. They are long-term positively correlated, meaning that an increase in temperature is more likely to be followed by another increase.
Temperature time series have a multifractal nature; however, weather conditions and the geographic position strongly affect the strength of their multifractality. Multifractality is stronger in subequatorial region.
Regarding the spectral asymmetry spatial distribution, it is observed that except in Kandi, the spectral asymmetry values are negative, therefore the spectrum is left-skewed.
Long-range temporal correlations for small and large fluctuations and a fat-tailed probability distribution are two major sources for multifractality of temperature; however, fat-tailed probability distribution contributes more to multifractality.
Future works will be focused on the investigation of the relationship between the predictability ofthe meteorological time series and their multifractal nature in different climatic conditions.

