


 Inglês (pdf)
 Artigo em XML
 Referências do artigo
 Enviar este artigo por email
 Citado por SciELO
  Citado por Google
  Similares em
SciELO
Similares em
SciELO  Similares em Google
 Permalink
Introduction
With the development and progress of the society, the demand for energy in various fields is constantly increasing. Therefore, petroleum geological exploration technology is facing more severe challenges. Multi - channel, multi - means, multi - discipline cross - fusion has become the development trend of exploration and development technology (Deng et al., 2017).
The early geological exploration objects in China are mainly sand and mudstone reservoirs, and lithology identification is relatively simple. With the continuous development of geological exploration and development, the requirement of well logging technology is gradually improved, and in order to form a more reasonable well logging interpretation method, lithology identification technology is also improved. Lithology identification belongs to the category of logging engineering and is an important research content in reservoir description, formation evaluation and drilling monitoring. The commonly used methods to obtain formation lithologic information include cuttings logging, coring section analysis and comprehensive treatment of logging data (Wei et al., 2017). Among them, the quality of cuttings logging depends on the operation of technicians, which is greatly influenced by human factors. The process of core slice analysis is time-consuming and laborious, and it is difficult to describe the complete well formation profile. In terms of comprehensive processing of logging data, crossplot method can intuitively reflect the boundary interface and lithological distribution area of different lithologies, and has the advantage of intuitive reading. However, its operation process is complex, and it cannot identify the whole well or interpret lithological information of the well. The mathematical statistical method is suitable for well logging data with good physical characteristics, and has a good application effect when there are few core data and more logging data, but it is very difficult to obtain the empirical formula (Xie et al., 2018; Jia et al., 2018; Jiang et al., 2018).
Artificial intelligence is a branch of computer science. It is a technology used to simulate, extend and expand human intelligence. It can simulate human consciousness, thinking and information formation process. Research in this field includes robotics, language recognition, image recognition, natural language processing and expert systems. It can be said that artificial intelligence is a very challenging science, which requires not only computer knowledge, but also knowledge in fields such as psychology and philosophy (Deng et al., 2018). Artificial intelligence research, on the whole, one of the main goal is to make the machine to be able to do some human intelligence is needed to complete a complex work, namely through the use of computers to simulate human thinking process and intelligent behavior of the discipline, can say it is almost covered all subjects of natural science and social science, its scope has been far beyond the scope of computer science (Guzman & Aoyama, 2018).
In recent years, artificial intelligence has become one of the main methods of pattern recognition in various fields. For example, BP neural network and fuzzy cluster analysis method. Although the BP neural network method has some disadvantages such as local minimization, slow convergence rate and different structure selection, it has the ability of distributed processing, self-learning, self-organization, highly nonlinear mapping and fault tolerance, which greatly makes up for the deficiency of self-recognition performance.
Therefore, in order to improve the ability of identifying lithology of oil logging in low permeability reservoirs, artificial intelligence technology is introduced in this study.
Application research on reservoir oil logging location prediction
When predicting the location of reservoir oil logging, first of all, do not collect logging data. In this process, various interference factors inevitably exist, which affect the resolution of the signal. Linear combination of sensitive indexes with high correlation is an effective method to improve the accuracy of logging interpretation. Therefore, on the basis of selecting the logging data of the core well, the logging data is compared with the core data by the multi-index radar chart comparison method. The execution flow of the radar chart drawing program is shown in Figure 1.

According to the implementation process of the radar chart drawing program as shown in Figure 1, sensitive indexes that can reflect the lithologic change characteristics are selected, and then the correlation coefficient of the selected sensitive indexes is obtained, and the indexes with good correlation are combined linearly. Although the noise is random in the radar map drawing process, the linear combination process can enhance the formation characteristic information, and highlight the useful information by superposition signal, thus reducing the signal interference (Han et al., 2019).
The dimensions of different logging indicators are often different. In order to combine the indicators of different dimensions, it is necessary to normalize the indicators and then combine the dimensionless data to form new analysis indicators. Firstly, the radar map is used to analyze the logging data, and the log phase identification curve set is established through the standard well. Then, the logging location of the reservoir of the unknown well segment is identified by using the curve difference comparison, and the logging data of the core well is obtained after sorting out and correcting the analysis data, and the clustering normalization is completed. After calculation, the following results can be obtained:
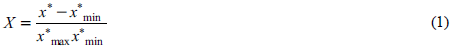
Among them, X represents the normalized log curve, x* represents the original log data, x * min . and x max * represent the maximum and minimum values of the log curve respectively. It is easy to realize the linear normalization method with the powerful matrix operation of MATLAB, but in the transverse comparative analysis of multiple Wells, the difference of normalization results will be caused by the different selection of maximum and minimum values, thus affecting the analysis results. Therefore, data expansion or shift processing is carried out in this paper according to the value situation (Zhou et al., 2019; Jia & Deng, 2018). For example, after analyzing logging and core data, it can be seen that a certain reservoir is located in the second section, which is dominated by grayish-white medium-grain lithic sandstone, and its density (DEN) value is mostly around 2~3 g/cc. At this point, if we can extract the fractional part, magnify the difference between maximum and minimum, we will get a better comparison effect. On this basis, all the above density measurements were summarized and five parameters of AC, DEN, CNL, GR and RD were selected to depict the logging phase position radar map of the traveling gas layer, gas bearing layer and gas layer, as shown in Figure 2.
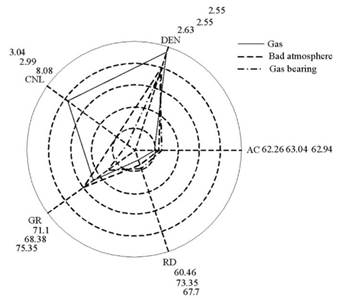
According to the different density ranges shown in Figure 2, it is obvious that CNL can reflect different density differences to a certain extent, which corresponds to the location of oil logging in low-permeability reservoirs. Samples of rock sections are randomly selected within the determined location range to determine the pore characteristics of rocks in low-permeability reservoirs.
Pore characteristics of low permeability reservoir rock
When judging non-uniform properties of low permeability reservoirs, pressure pump experiments should be carried out in low permeability reservoirs according to thin sections obtained by well logging, and rock characteristic data information should be obtained by nuclear magnetic test. The characteristic data are shown in Table 1.
Table 1 Rock mass characteristic data table
| Serial number of rock mass | Porosity/ % | T2cutoff/ ms | NMR bound water saturation/ % | Maximum throat radius /um | Mean throat radius/um | Sorting coefficient | Expulsion pressure/ Mpa | T2LM/ ms | Permeability/ 10-3um-2 |
|---|---|---|---|---|---|---|---|---|---|
| 12-1 | 6.71 | 22.68 | 64.26 | 11.92 | 0.44 | 0.14 | 0. 26 | 1.70 | 0.07 |
| 61-1 | 6.77 | 21.99 | 65.77 | 11.41 | 0.60 | 0.16 | 0.31 | 1. 26 | 0.13 |
| 64-1 | 7.89 | 11.01 | 73.22 | 575 | 0.55 | 0.05 | -0.31 | 1.36 | 0.11 |
| 62R | 13.50 | 16.26 | 43.01 | 21.25 | 1.00 | 0.05 | -0.43 | 0.75 | 0. 56 |
| 18.00 | 6.90 | 7.90 | 42.21 | 11.06 | 1.22 | 0.04 | -0.66 | 0.61 | 0. 28 |
| 51B | 10.60 | 18.00 | 40.60 | 26.24 | 1.15 | 0.12 | -0.18 | 0.65 | 0.42 |
| 9-35 | 6.99 | 2.66 | 52.40 | 3.96 | 1.19 | 0.02 | -0.94 | 0.63 | 0.68 |
| 70-1 | 5.62 | 1.55 | 57.21 | 1.93 | 0.33 | 0.00 | -0.86 | 2.28 | 0.08 |
| 19-1 | 9.73 | 16.79 | 41.10 | 28.16 | 1.17 | 0.06 | -0.31 | 0.64 | 0.23 |
| 34-4 | 12.77 | 5.85 | 46.97 | 9.78 | 2.60 | 0.21 | -0.20 | 0.29 | 3.59 |
| 52-1 | 11.37 | 10.54 | 83.37 | 3.01 | 0.34 | 0.05 | -0.42 | 2.21 | 0.15 |
| 64-1 | 8.12 | 7.41 | 64.15 | 6.47 | 0.89 | 0.07 | -0.46 | 0. 84 | 0.41 |
| 93-1 | 16.65 | 8. 26 | 42.68 | 17.19 | 20.06 | 0.17 | -0.53 | 0. 20 | 42.30 |
| 115-1 | 14.92 | 10.39 | 52.38 | 10.46 | 3.81 | 0.03 | -0.74 | 0.56 | 4. 85 |
| 9-1 | 11.57 | 6. 80 | 61.11 | 5.54 | 1.35 | 0.07 | -0.32 | 0.17 | 0.91 |
| 20-1 | 11.76 | 6.67 | 46.52 | 9.32 | 4.29 | 0.91 | 0.41 | 0.98 | 17.27 |
| 68-1 | 6.38 | 2.75 | 85.97 | 1.09 | 0.76 | 0.02 | -0. 94 | 1.39 | 157 |
| 137.00 | 10.45 | 7.77 | 79.32 | 2. 98 | 0.54 | 0.03 | -0.75 | 1.40 | 0.79 |
| 152-1 | 8.35 | 40.30 | 83.07 | 7.01 | 0.54 | 0.04 | -0.48 | 0.98 | 0.87 |
| 3-1 | 6.26 | 27.35 | 67.35 | 9.17 | 0.76 | 0.30 | 0.81 | 2.01 | 0.63 |
| 30-1 | 5.52 | 1.68 | 91.38 | 0. 87 | 0.37 | 0.04 | -0.40 | 0.22 | 0.52 |
| 91-1 | 10.56 | 13.81 | 45.54 | 15.45 | 3.35 | 0.19 | -0.20 | 1. 26 | 3.38 |
| 144-1 | 8.21 | 61.52 | 67.08 | 35.12 | 0.60 | 0.10 | -0.02 | 1.09 | 0.70 |
| 216-1 | 9.47 | 52.66 | 59.96 | 41.56 | 0.69 | 0.17 | 0.23 | 1.23 | 0.97 |
| 236-1 | 8.17 | 36.92 | 62.34 | 27.80 | 0.61 | 0.16 | 0.34 | 1. 20 | 0.85 |
| 257-1 | 6.90 | 46.74 | 56.18 | 42.06 | 0.63 | 0.21 | 0.62 | 0. 20 | 0.42 |
Referring to the data information in Table 1, the "three porosity component percentage method" was used to process the above 26 rock samples, to qualitatively classify the pore types of the rock samples, and to draw the corresponding cross plot of pore structure parameters (Wang & Siau, 2019), as shown in Figure 3.
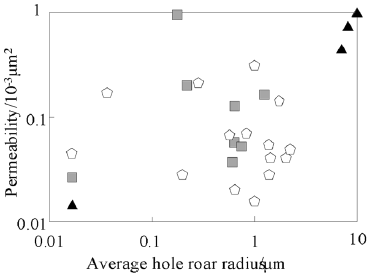
By referring to the cross plot of pore structure parameters shown in Figure 3, it can be seen that the T 2 spectrum measured by NMR consists of three kinds of transverse relaxation time, that is, the T 2 spectrum observed is:

Where, T2 denotes transverse relaxation time, T 2B denotes volumetric (free) relaxation time of the fluid, T 2D denotes diffusive relaxation time, and denotes surface relaxation time. T 2S and T2D were characterized by specific surface area, diffusion coefficient, magnetic field gradient, echo interval and other parameters, and then:
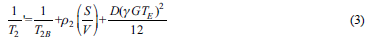
Among them, ρ 2 represents the transverse surface relaxation strength of the rock, S represents the surface area of pores, V represents the volume of pores, V represents the specific surface area of characterized rock samples, D represents the diffusion coefficient, G represents the magnetic field strength, T E represents the echo interval, y represents the magnetic rotation ratio, and the remaining parameters remain unchanged. For the uniform magnetic field with a small echo interval, Equation (2) can be transformed into:
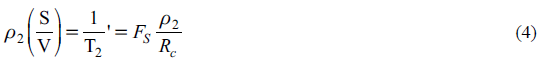
Where, F S represents the geometric shape factor, and for spherical pores, the value of F S is 3; For columnar pores, F S has a value of 2. R C represents the pore radius.
Generally speaking, the relaxation time of pore fluid is related to the size and shape of pore space (Grzonka et al., 2018; Gobashy et al., 2020). Since there should be a corresponding transverse relaxation time for a particular R C , T2 and R C should have a one-to-one correspondence. However, due to the constant change of F S , the corresponding relationship between T2 and R C also changes. For medium - high porosity and permeability reservoirs, reservoir heterogeneity is weak, and the corresponding relationship between T2 and R C has little change. However, for tight sandstone reservoirs with complex pore structure and pore type, the corresponding relationship between T2 and R C changes greatly due to their strong reservoir heterogeneity.
According to fluid mechanics, there is a certain relationship between capillary pressure and pore radius:

Where, P c represents capillary pressure, σ represents fluid interfacial tension, and θ represents wetting contact Angle. For mercury-air system, Equation (4) can be rewritten as:
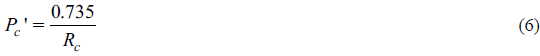
The comprehensive calculation formulas (3) and (5) can be obtained as follows:

Where, C represents the conversion coefficient, and. Therefore, if the conversion coefficient can be accurately calculated by using the well log, the capillary pressure curve at different depths of the whole well can be evaluated by using the NMR log, and the variation of various pore structure parameters with depth can also be evaluated (Zibret, 2019).
Generally, the pseudo-capillary pressure curve and the capillary pressure curve of the pore segment cannot be superimposed together, because of the accumulation of thin film bound water with large pores in T2 distribution to small pores (Zhang, 2019). Based on this idea, a piecewise power function calibration method is proposed to solve the problem of low precision of pressure curve conversion of small pore capillary. In theory, the specific surface area has a linear relationship with the pore size, but for the actual formation, the pore structure is very complex, and the specific surface and pore size often have a nonlinear relationship, which can be expressed as follows:
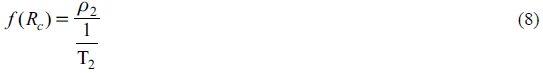
Where, f(R C ) represents the function of R C . According to Equation (5) and Equation (7), the function of T2 spectrum can be calculated as follows:
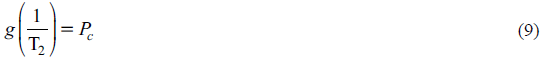
According to the above formula, the pore characteristics of low-permeability reservoir rocks can be divided into large pores and small pores, and the pore characteristics can be described as follows:
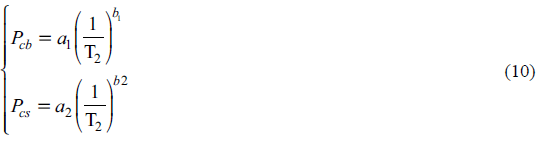
Where, a1 and b1 represent the corresponding parameters of small pores, and a2 and b2 represent the corresponding parameters of large pores. Referring to the pore characteristics obtained, crossplot method can be used to obtain logging response characteristics that can represent lithology.
Obtain logging rock mass response parameters
The cross-plot method is used to summarize the pore data obtained above and form a plan. According to the coordinates of the intersection point, the numerical value and aggregation trend of the parameters can be seen. In the process of using the crossplot method to identify lithology, two groups of appropriate logging data are first selected, and coordinate points are drawn in the crossplot coordinate system according to the changes of logging data. The aggregation trend of coordinate points is expressed in the form of intuitive data, and the distribution range and boundary of different lithology can be reflected visually. The crossplot drawn should be compared with the coring lithology data for better accuracy of lithology identification. Cross-graphs such as GR-PB and GR-AC can be made according to the core analysis data. According to these cross-graphs, the positions of different measured lithologic points, the lower limit of lithologic logging parameters and the lithologic distribution trend can be determined. Referring to logging rock masses of different densities and using the ratio of spectral intensity of elements, structural logging rock characteristic parameters are as follows:
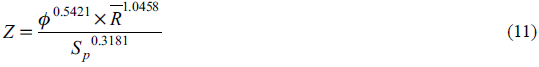
Among them, Z represents logging rock characteristic parameters, ф represents porosity calculated above, R represents average pore throat radius, S p represents sorting coefficient, and two constants represent permeability measured. Logging rock characteristic parameters were defined to be around 80-110, and the acoustic wave presented high value, which was generally above 67, with the development of porosity structure. When the characteristic parameters of logging rocks are above 120 and the acoustic values are generally above 70, the fused tuff appears in the logging interior. When the characteristic parameters of logging rocks are distributed around 40-120 and the acoustic values are generally below 65, the characteristic values cannot be determined, and the rock mass is also a fused tuff. According to the calculated logging rock characteristic parameters, the cross map of Gr-pb within the logging location was obtained, as shown in Figure 4.
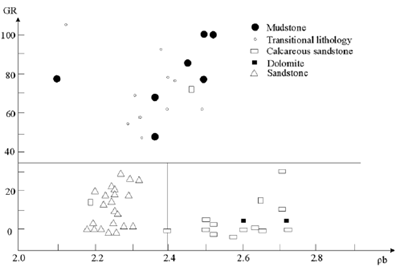
As can be seen from the logging characteristic parameters shown in Figure 4, different rock assemblages have great differences in layers, and their electrical properties are also different. Therefore, before obtaining the response characteristics in the logging, linear transformation should be adopted to normalize the electrical properties in the logging characteristic parameters, and the standardization process is as follows:
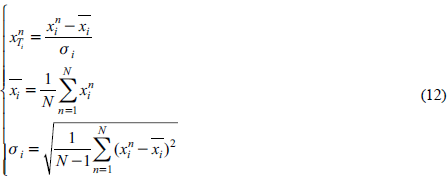
Where, Where, 111 represents the n the standardized value of x
i
.,  represents the mean value of the electrical variable, a. represents the standard deviation of the electrical variable, and N represents the number of logging characteristic parameters. The response values of acoustic time difference (AC), natural gamma (GR) and resistivity (RT) obtained by using the above standardized electrical property values combined with the curve overlap method are comprehensively judged. The difference, acoustic time difference (AC), natural gamma (GR) and resistivity (RT) of porosity <p
D
and <¡> extracted by the overlapping method are shown in Table 2.
represents the mean value of the electrical variable, a. represents the standard deviation of the electrical variable, and N represents the number of logging characteristic parameters. The response values of acoustic time difference (AC), natural gamma (GR) and resistivity (RT) obtained by using the above standardized electrical property values combined with the curve overlap method are comprehensively judged. The difference, acoustic time difference (AC), natural gamma (GR) and resistivity (RT) of porosity <p
D
and <¡> extracted by the overlapping method are shown in Table 2.
Table 2 Parameter set matrix table
| Overlapping layer | фD- фN | The mean AC(us/ft) | The mean GR(API) | The mean RT(Qm) |
|---|---|---|---|---|
| 1 | -0.179 | 53.094 | 49.902 | 230.441 |
| 2 | -0.143 | 53.512 | 54.729 | 235.899 |
| 3 | -0.135 | 53. 539 | 52.784 | 238.887 |
| 4 | -0.132 | 53.539 | 47.642 | 242.040 |
| 5 | -0.089 | 52. 870 | 42.829 | 253.606 |
| 6 | -0.011 | 51.491 | 39.953 | 263.617 |
| 7 | -0.056 | 50.794 | 41.874 | 268.003 |
| 8 | -0.081 | 50.525 | 45.082 | 285.795 |
| 9 | -0.105 | 50.318 | 47.851 | 321.116 |
| 10 | -0.108 | 50.347 | 45.627 | 337.462 |
| 11 | -0.110 | 50.453 | 45.927 | 339.846 |
| 12 | -0.109 | 50.542 | 43.827 | 294.277 |
| 13 | -0.121 | 50.374 | 42.100 | 263.586 |
| 14 | -0.085 | 53.412 | 49.902 | 213.427 |
The data shown in Table 2 are integrated into the calculation formula of logging response characteristic parameters, as shown below:
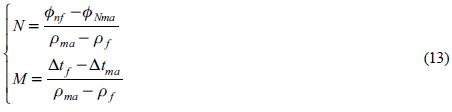
Among them, ∆t f represents acoustic time difference of pore fluid, ∆t ma represents acoustic time difference of rock skeleton, p ma represents pore fluid density, ф ma represents neutron porosity of rock skeleton, and ф nf represents neutron porosity of pore fluid. By referring to the calculation results of different characteristic parameters, the response values of corresponding logging lithology were calculated, as shown in Table 3.
Table 3 Response values of logging lithology
| Logging | AC | DEN | CNL | GR |
|---|---|---|---|---|
| lithology | (us/ft) | (g/cm3) | (p.u.) | (API) |
| Cloud mass limestone | 45.25~47 | 2.17~2.79 | -1~0 | 10 |
| Gray dolomite | 43.5~45.25 | 2.79~2.81 | 0~1 | 10 |
| Limestone | 48 | 2.71 | -1 | 10 |
| Dolomite | 43.50 | 2.87 | 1 | 10 |
| Argillaceous Limestone | 59 | 2.12 | 21.50 | 57.50 |
| Anhydrite | 49.30~51.80 | 2.91~3.02 | -2 | 1.50~6 |
| Paste dolomite | 43.50~46.75 | 2.87~2.91 | -1~0.50 | 5.80~10 |
| Cream quality Limestone | 49 | 2.71~2.915 | -1.50~1 | 5.80~10 |
Corresponding to the response values of different characteristics shown in Table 3, the properties of different logging rocks can be determined. Thus, the application of artificial intelligence in lithology identification of low permeability reservoirs is completed.
Simulation experiment and result analysis
In order to verify the practical application performance of the low permeability reservoir logging lithology identification method designed in this paper by using artificial intelligence, the following simulation experiment is designed for verification.
The experiment to prepare
Firstly, a basic LIBS detection system is set up, which mainly includes light source, light splitting system, photoelectric detector, timing control module, collimation, focusing light path, light collection lens group, sample table and so on. Imaging of laser-induced plasma is also required during the experiment, so imaging modules should be set up in the LIBS detection system. The experimental platform structure is shown in Figure 5.
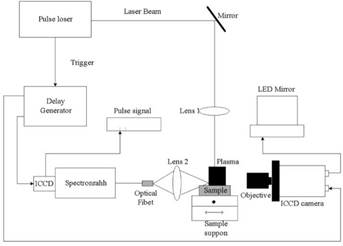
As shown in Figure 5, the main performance parameters of the ME5000 medium-step grating spectrometer in the experimental platform are shown in Table 4.
Table 4 Main performance parameters of ME5000 medium - step grating spectrometer
| Parameter | Data | |
|---|---|---|
| Escher spectrometer | Focal length (mm) | 195 |
| Aperture | F7 | |
| Wavelength range (nm) | 230~950 | |
| Wavelength accuracy (nm) | ±0.05 | |
| Focal plane size (mm) | 13.3x13.3 | |
| Stray light | 1.5x10⁻⁴ | |
| ICCD | Active pixel | 1024x1024 |
| Effective pixel size (Nm) | 13 | |
| Effective area (mm) | 13.3x13.3 | |
| Peak quantum efficiency | up to 18% | |
| Total insertion delay (NS) | ~35 | |
| DDG | Insert delay (NS) | ~19 |
| Gate delay | 0~25s | |
| Delayed resolution | 25ps | |
| Width of the gate | 1ns~25s | |
| Width resolution | 25ps | |
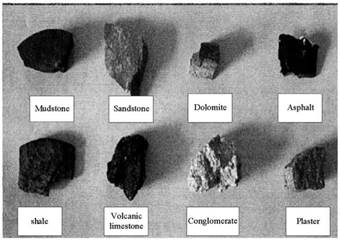
Under the control of the performance parameters shown in Table 4, 8 logging blocks as shown in Figure 6 are prepared.
Use as shown in Figure 6 to mudstone, shale, sandstone, dolomite, asphalt, volcanic ash, conglomerate and paste rock, in the experimental environment, were used in this paper, design of using artificial intelligence low permeability oil reservoir logging lithology identification method and the traditional lithology recognition method based on laser induced breakdown spectroscopy, logging lithology recognition method based on Boosting Tree algorithm comparing experiment, from lithology recognition accuracy and recognition process takes two Angle compared three methods of recognition performance.
Experimental results and analysis
Taking mudstone samples as an example, based on the above experimental preparation, the standard reference spectrum of mudstone samples was first obtained by using ME5000 medium-step grating spectrometer, as shown in Figure 7.
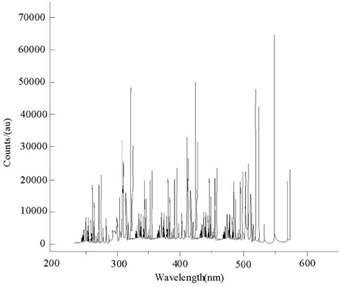
After obtaining the standard spectrum of mudstone samples, under the same experimental conditions, used respectively in this paper, the design of the use of artificial intelligence in the low permeability oil reservoir logging lithological identification method and the traditional lithology recognition method based on laser induced breakdown spectroscopy, logging lithology recognition method based on Boosting Tree algorithm for mudstone samples of spectral information. In order to avoid the spectral line position drift caused by temperature change, the experimental room temperature should be controlled within the range of 25-30 °C. On this basis, the similarity between the spectral information of mudstone samples obtained by three different identification methods and the standard spectra was compared. When the position and relative strength of spectral lines between the three different identification methods were consistent, the recognition was deemed as a success. The recognition results obtained by the three recognition methods are shown in Table 5.
Table 5 Statistical table of identification results of different methods
| Rock mass classification | Number of test samples /number | Logging lithology identification method based on Boosting Tree algorithm | Method of this paper | Lithology identification method based on laser induced breakdown spectroscopy | ||||
|---|---|---|---|---|---|---|---|---|
| Correctly identify quantity/number | Recognition accuracy/% | Correctly identify quantity/number | Recognition accuracy/% | Correctly identify quantity/number | Recognition accuracy/% | |||
| Mudstone | 8 | 4 | 50 | 8 | 100 | 6 | 75 | |
| Sandstone | 8 | 3 | 37.5 | 8 | 100 | 5 | 62.5 | |
| Shale | 8 | 4 | 50 | 7 | 87.5 | 6 | 75 | |
| Volcanic ash | 8 | 3 | 37.5 | 8 | 100 | 7 | 87.5 | |
| Dolomite | 7 | 3 | 42.8 | 6 | 85.7 | 5 | 71.4 | |
| Cream rock | 2 | 1 | 50 | 2 | 100 | 2 | 100 | |
| Conglomerate | 7 | 5 | 71.4 | 7 | 100 | 6 | 85.7 | |
| Asphalt | 4 | 2 | 50 | 4 | 100 | 3 | 75 | |
According to the experimental results shown in Table 5, the three identification methods can be used to identify the same number of different types of logging rock mass information, and the three identification methods show different identification capabilities. After applying the logging lithology identification method based Boosting Tree algorithm, the number of rock masses identified is too small and the identification accuracy is low. However, the identification accuracy of lithology based on laser-induced breakdown spectroscopy has been improved, but the information of other rock masses has not been fully identified except for the gypsum rock. After the application of this method, except dolomite and shale, the information of other rock mass is correctly identified, and the correct identification rate of this method is the largest among the three methods. Based on the above experimental results, it can be seen that the rock mass identification method designed in this paper with artificial intelligence technology can avoid the deficiency of identifying too few rock masses, and the identification accuracy is higher, which is suitable for the identification of lithology of oil logging in low-permeability reservoirs.
On this basis, the identification performance of the three methods is verified by taking the identification process time as the index. The results are shown in Figure 8.
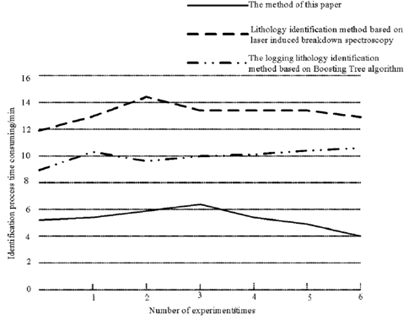
According to the experimental results shown in Figure 8, the three identification methods can be used to identify the same number of different types of logging rock mass information, and the time of the three identification methods is greatly different. The well logging lithology identification method based on Boosting Tree algorithm has a identification process of 8-12min. The lithology identification method based on laser induced breakdown spectroscopy technology is higher and keeps between 12-15min. However, the identification process of the method in this paper takes the least time among the three methods, which is always kept below 7min. Based on the above experimental results, it can be seen that the rock mass identification method designed in this paper with artificial intelligence technology can quickly identify the lithologic characteristics of oil logging in low-permeability reservoirs.
Conclusion
Automatic identification of lithology is based on the combination of mathematical theory and computer software. This process fully embodies the interdisciplinary application, which can be used as a supplement to the conventional lithology identification method and promote the development of the lithology identification technology with multiple approaches, methods and angles. The appearance of artificial intelligence lithology identification software plays a powerful role in promoting the technology of complex formation lithology classification. In this paper, the application of artificial intelligence technology to low permeability reservoir oil logging lithology identification is proposed. It has been proved by practice that this method can effectively improve the accuracy of lithology identification in low permeability reservoir, and the identification process is time-consuming.

