


Serviços Personalizados
Journal
Artigo
 Inglês (pdf)
 Artigo em XML
 Referências do artigo
 Enviar este artigo por email
Indicadores
-
 Citado por SciELO
 -
 Acessos
Links relacionados
-
 Citado por Google
 -
 Similares em
SciELO
Similares em
SciELO -
 Similares em Google
Compartilhar

 Permalink
Tecciencia
versão impressa ISSN 1909-3667
Tecciencia vol.11 no.20 Bogotá jan./jun. 2016
https://doi.org/10.18180/tecciencia.2016.20.8
DOI: http://dx.doi.org/10.18180/tecciencia.2016.20.8.
Thermodynamic Analysis of Self-Ignition in Spark-Ignited Engines Operated with Alternative Gaseous Fuels
Análisis Termodinámico de la Autoignición en Motores de Encendido Provocado Operados con Combustibles Gaseosos Alternativos
Jorge Duarte1*, Wilman Orozco1, Jorge González1, Edgardo Buelvas1, Lesme Corredor2
1 Universidad Antonio Nariño, Sede Pto Colombia, Atlántico - Colombia
2 Universidad del Norte, Atlántico - Colombia
* Corresponding Author. E-mail: jorge.duarte@uan.edu.co.
How to cite: Duarte, J., et al., Thermodynamic Analysis of Self-Ignition in Spark-Ignited Engines Operated with Alternative Gaseous Fuels, TECCIENCIA, Vol. 11 No. 20, 57-65, 2016, DOI: http://dx.doi.org/10.18180/tecciencia.2016.20.8.
Received: 27 Nov 2015 Accepted: 11 Feb 2016 Available Online: 29 Feb 2016
Abstract
Currently, detailed studies exist on the self-ignition phenomenon in liquid fuels and even for natural gas. However, studies for syngas are quite limited and existing ones are mainly focused on combustion kinetics and do not study self-ignition prior to the ignition point. This paper presents the development of a thermodynamic analysis to study the self-ignition phenomenon in gaseous alternative fuels during the compression stroke in spark-ignited internal combustion engines. Analysis takes into account the fuel composition, relevant process parameters, and variation due to pressure and temperature intake changes. The approach is focused on equilibrium thermodynamics, which easily allows estimating engine operating conditions. These results permit studying adequate compression ratios to obtain good efficiencies, as those achieved by using natural gas, but in heat engine applications to generate power with low-methane-number syngas fuels.
Keywords: Self-ignition, Gaseous Fuels, Combustion, Internal Combustion Engines.
Resumen
En la actualidad, existen estudios detallados del fenómeno de la auto-detonación en combustibles líquidos e inclusive para el gas natural. Sin embargo, los estudios para gas de síntesis son muy limitados y los existentes se centran principalmente en la cinética de la combustión y no se ha estudiado el autoencendido antes del punto de ignición. En este trabajo se presenta el desarrollo de un análisis termodinámico para estudiar el fenómeno de auto-ignición en combustibles gaseosos alternativos durante la carrera de compresión, cuando son utilizados en motores de encendido provocado. El análisis tiene en cuenta la composición del combustible, los parámetros relevantes del proceso y la influencia debido a los cambios de presión y temperatura en la admisión. El enfoque se centra de la termodinámica de equilibrio, lo que permite una estimación práctica de la condición de funcionamiento del motor. Estos resultados permiten estudiar las relaciones de compresión adecuadas con el fin de obtener eficiencias similares a las obtenidas utilizando gas natural, pero en aplicaciones de motores térmicos para la generación de energía eléctrica utilizando gas de síntesis de metano bajo número como combustible.
Palabras clave: Auto-ignición, Combustibles Gaseosos, Combustión, Motores de Combustión Interna.
1. Introduction
Use of gaseous fuels in spark-ignited internal combustion engines has increased in recent years, but their increased efficiency is a limitation given that compression ratio cannot be increased significantly the compression ratio [1]. The aforementioned is because increased compression ratio (CR) increases the tendency for the occurrence of a phenomenon denominated self-ignition, which takes place when at the start of the combustion in the air-fuel mixture happens prior to the spark ignition, which causes quite high pressure peaks and a shock wave within the chamber. This self-detonation phenomenon is linked to the methane number, and is inversely related to it; a lower methane number implies a lower risk of this phenomenon occurring [1].
Given that synthesis gases have low methane numbers, it is necessary to control the combustion process to inhibit self-detonation and, thus, guarantee the use of these fuels. Additionally, the engine’s compression ratio needs to be increased to improve efficiency and compensate for the lower power delivery, a product of low calorific value of synthesis gases.
When the combustion process does not occur correctly, as in the mentioned phenomenon, or due to the presence of surface ignition, it may generate serious damage to the engine, become a source of noise and vibration, and produce poor engine operating performance. The "knock" is a consequence of the self-ignition phenomenon and it is characterized by noise, which is transmitted throughout the whole structure when spontaneous ignition of the air-fuel mixture takes place.
The self-ignition phenomenon is highly sensitive to the composition of the gaseous fuels. The appearance of the phenomenon generates higher fuel consumption, increased emissions, loss of performance, and severe damage to the engine [1]. It is common to use a parameter analogous to the octane number of gasoline, the already mentioned methane number, as an empirical parameter to classify natural gases and their tendency to for self-detonation, but given that in engines using this type of fuel there is a high range of variation of operating conditions, regarding pressure and temperature the parameter mentioned is not entirely reliable.
Current studies on self-detonation in gaseous fuels address the topic focused toward combustion kinetics, applying complex computer algorithms to simulate the phenomenon. A complete and important research was that by Sridhar [2], which validated several computer models with the experimental results of combustion of gases with different composition. The rate of flame propagation was specifically measured, which must be considered for the combustion to be within the appropriate ratio range of turbulent flame. The work by Buttsworth [3] also used computer simulation to predict self-detonation.
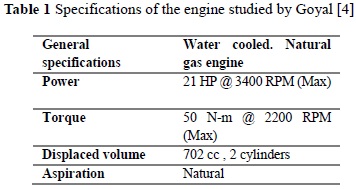
Another study providing important results was that by Goyal [4], which took a four-stroke spark-ignited engine operating with natural gas with a high methane number and introduced into it a gas with low methane number. The specifications of the engine used by Goyal [4] in said study are illustrated in Table 1.
It was theoretically calculated that the power loss expected due to the fuel change is 46%, which is significant, bearing in mind that parameters like compression ratio were not varied. It was found that when using the fuel with low methane number, the temperature of gases decrease.
The work by Hernández [5] used computational tools to study the kinetics of gases with low methane number, obtaining ratios among the laminar flame speed for different rates of fuel consumption, temperature values, pressure, and gas/air equivalency ratios. An approximate expression for the temperature profile was obtained.
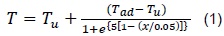
Where Tu (°K) is the unburned mixture temperature, Tad (°K) is the adiabatic flame temperature of the mixture, and x (cm) is the spatial coordinate. The thermodynamic approach to analyze self-ignition has been addressed by various authors.
This research applied finite time thermodynamic analysis to characterize the effects of parameters like ignition advance, fuel ratio, temperature of the internal cylinder wall to obtain a description of the temperatures at the ignition point and carry out an optimization process to get them below the self-ignition temperature of the air-fuel mixture.
2. Materials and Methods
2.1. Establishing the model
Traditional studies on self-detonation show as significant variables of the phenomenon: the compression ratio, the composition of the gaseous fuel, the air/fuel ratio, the ignition angle, and the engine’s geometric parameters, but the phenomenon’s behavior can vary with the geographic location of the engine in operation. Thus, in cities located at high altitudes (low atmospheric pressure) it has been experimentally determined that there is increased tendency toward self-detonation [6]. Likewise, in places with great environmental temperature variability, it is noted that upon increasing such, the tendency to self-ignition of the air-fuel mixture in the engine increases [5].
The influence of atmospheric pressure is not as clear at a glance, but if analyzed, describing the thermodynamic process as polytropic, it may be inferred that, by having a drop in intake pressure, output temperature increases. Using this representation will permit analyzing the mixture’s behavior for different environmental conditions.
To develop the model, some hypotheses and conditions were established; one of these, was that the process is quasistatic, which is why it may be described through the relationship PVn = cte. This type of process is denominated polytropic.
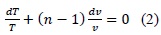
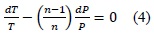
Normal processes of gas compression or expansion are not adiabatic or isothermal. Habitually, these processes may approach polytropics with 1 < n < k, where k is the isentropic coefficient [7]. Bearing in mind the application of these types of processes, we can relate differentially variables P, T, and V as follows:
By solving the prior expressions, it is possible to know the final state, which will permit knowing the temperature at a given point of the piston stroke. The mixture volume in the cylinder can be expressed in function of the crankshaft position and time, for which a dynamic model may be generated for a specific stage of the engine cycle. Now, we have that in real life a heat transfer process exists, where energy is transferred through the cylinder walls and from the exhaust gases, which are important factors to consider.
Also kept in mind was the amount of heat from the burnt gases trapped in the volume defined by the engine’s top dead center, which will be at the temperature of the exhaust gases. This fraction of burnt gas will be mixed with the fresh airfuel load entering the combustion chamber, causing temperature to increase. Additionally, heat transference must be considered. Then, through the definition of the polytropic process for a stationary work state (amount of heat constantly removed), we have that the polytropic coefficient considers this phenomenon, which is why if we characterize a combustion chamber for determined working conditions; this should replicate the result for other conditions. This assumption was validated through experimental data.
Given that it is clear that they have a broad range of temperatures from the intake of fresh air-fuel mixture (0 - 50 °C) to the temperature at the ignition point (520 - 600 °C), thermodynamic properties are not constant. It is necessary to determine the value of these properties through experimental correlations, like: a+b*T+c*T2+...+d*Tn. These correlations are highly precise, which is why we can values of properties in function of the composition of the working fluid and temperature with good reliability [7].
The assumptions and considerations made previously must be experimentally validated, which will be done in the following section.
2.2. Thermodynamic development of the model
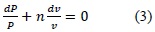
As mentioned in phase 1, a polytropic process of a system is described through a pressure-volume ratio:

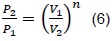
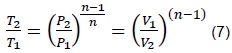
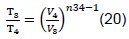
Where n is a characteristic constant of a process. For a polytropic process between two states, we have that:
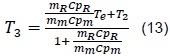
When n = 0, the process is isobaric (process at constant pressure) and when n = ∞, the process is isochoric (process at constant volume). The previous expression serves for any gas undergoing a polytropic process. The pressure-volume change may also be related to temperature, which is the situation presented within the combustion chamber.
During this stage, a thermodynamic analysis is made of the different stages of the process to obtain the equation that describes each state, establishing and specifying the conditions assumed to obtain each expression.
Figure 1 shows the schematic diagram of the system to be analyzed and its intermediate points.
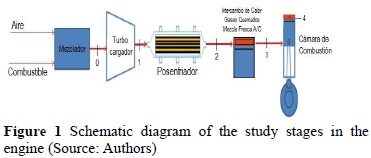
At point 0, there is a fresh air-fuel mixture at environmental temperature and pressure (after reaching equilibrium during the mix process). Then, the air-fuel mixture goes through the turbocharger, which will increase the pressure and temperature in the discharge (point 1). Thereafter, the compressed mixture goes through an after cooler, which diminishes temperature maintaining pressure practically constant (the pressure drop in these types of exchangers is negligible [8]).
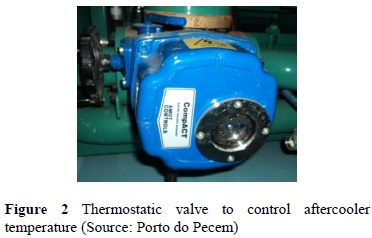
Diminished temperature in cooling systems in heat engines is controlled by two types of systems. By mechanical thermostats that cause a variable drop of temperature in function of the deformation of an inner spring. The second case, which is the case of modern engines, uses thermostatic valves - as illustrated in Figure 2, to maintain the constant temperature drop and improve equipment efficiency. Our case study used the second case, given that most current engines use these types of control actuators.
Upon reaching the temperature drop, we move to point 2 of the system, where the air-fuel mixture enters the combustion chamber and meets with the residual gas, a product of the combustion in the previous cycle [9]. This gas remains confined in the volume between the engine head and the top dead center. At this point we must know the composition of the fuel gas, that of the exhaust gases, and the ratio between fuel and air (F/A) to characterize the mixture [14], reaching point 3. Then, the compression process begins, which will be characterized by the combustion chamber’s geometric parameters. Bearing in mind the aforementioned, for the stage of the process from 0 to 1, we have:
From which we obtain:
Using the case of the constant temperature drop through thermostatic valves, we have:
By equaling the last two equations, we obtain:
Emission gases have remanent energy that, once the air-fuel mixture enters the combustion chamber, a heat transference process exists and, thus the mixture temperature increases. Expressed thermodynamically, we have:

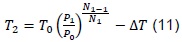
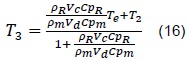
From where we obtain that the equilibrium temperature, T3, is given by:
In addition, we have:
mR is the mass of exhaust gases trapped in the combustion chamber. Vc is the volume existing between the engine head and the piston when it is located on the top dead center. Also, we have:
Where mm is the mass of the fresh mix entering the combustion chamber. The density of the mixture gases depends on the composition of the mixture and it is calculated with respect to the fraction of the total mixture content.
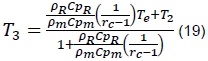
Replacing (14) and (15) in (13), we obtain:
Through Ganesan definition [10], we have that the compression ratio is given by:
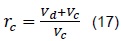
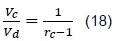
Replacing (18) in (16), we obtain:
For the polytropic compression process in the combustion chamber, we have:
From which we obtain:
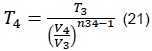
Volume, V4, is calculated, which is variable with respect to the angle of the connecting rod (ignition point), as illustrated in Figure 3.
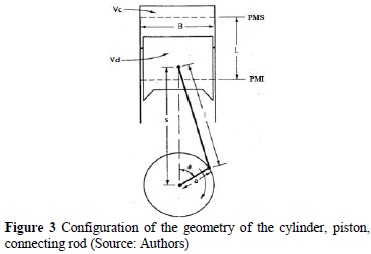
Where B = piston diameter, L = stroke, l = length of connecting rod, a = crankpin radius, and θ= angle of connecting rod. This volume is given by [8]:

Replacing the previous expression in (21), we obtain:
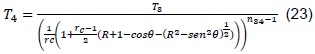
Finally, replacing (11) and (19) in (23), we obtain that:
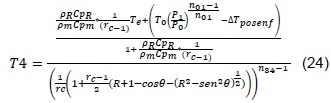
Where:
CpR: Specific heat of exhaust gases
Cpm: Specific heat of the air-fuel mixture
n01: Polytropic coefficient of the turbo-compression process
n34: Polytropic coefficient of the compression process in the combustion chamber. R: Ratio between length of connecting rod and crankpin radius
rc: Compression ratio
P0: Atmospheric pressure
ρR: Density of exhaust gases
ρm: Density of the air-fuel mixture
ΔT: Temperature drop of inter-cooler
θ: Crankshaft angle
Te: Temperature of exhaust gases
T0: Environmental temperature
The polytropic coefficients of the turbocharger, n01, and compression, n34, must be calculated experimentally for the engine under analysis [11].
2.3 Available equipment
To start the experimental validation process, commercial equipment was taken as reference, which was turbocharged and with considerable nominal power. The engine under study is described in Table 2.
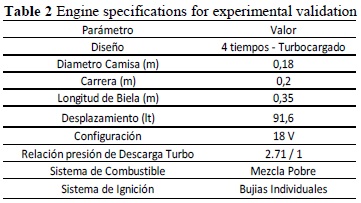
This engine has compression ratios of 12:1 and 10.55:1, which gives a variability of the compression ratio. The ignition point may be modified from 15° to 11°, which is configured depending on the quality of the fuel used and the geographic location of the equipment. The equipment has a single turbocharger, which yields a fixed discharge pressure ratio from 2.7 to 1. This equipment has a thermostatic control system, which permits having a fixed drop in the aftercooler from 40 °C to the air-fuel mixture current.
The experimental validation seeks to maximize the nominal output power of the equipment, which is why the calculations and measurements of the equipment were made in steady state, with a fixed load of 1.7 MW operating in island mode (Load Govern).
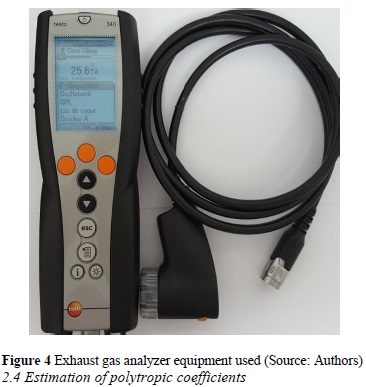
In addition to this, it is necessary to characterize and verify the composition of the exhaust gases; this was done by using a calibrated gas analyzer (Testo) (Fig. 4) to make measurements during the experimental phase.
2.4 Estimation of polytropic coefficients
To estimate the polytropic coefficients, an experimental design was organized [12], using pressure and environmental temperature, ignition angle, and compression ratio as factors to verify their significance and if their change significantly affected the model’s response.
A random process was conducted to keep hidden variables from generating effects upon the response [13]. Among these hidden variables are the environmental conditions, like air humidity; for now we will assume it is not significant and this assumption will be verified with a statistical analysis.
Data were taken in Bogotá and Barranquilla to have sufficient variability in the engines analyzed, which have different hours of work, wear, and operating conditions.
To calculate the polytropic coefficients, we have:
From where the polytropic coefficients are cleared, with which we obtain:
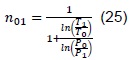
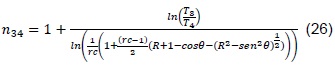
From the readings made, calculating with expressions (25) and (26), the following results were obtained:
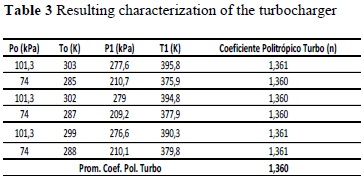
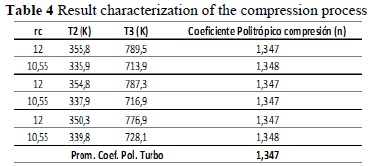
Note that in these results that, for a type of engine, the polytropic coefficient that characterizes the specific process does not change significantly, although disturbances may enter or factors change in the system. This implies that we can characterize an engine in a given place and work with a particular gas, extrapolating its behavior to other conditions.
2.5 Experimental validation
After estimating the polytropic coefficients of the turbocharger and of the compression process, and demonstrating that it is characteristic of the engine, independent of the place of work (but maintaining the engine at the same RPM and power level), we can proceed to estimate the temperature at the ignition point. To determine this temperature, we pried open the escape valves in the ignition point, so that the temperature sensor mounted on the escape port measures the average temperature. The previous temperature was compared to the self-ignition temperature of the air-fuel mixture, which for our case is 579 °C (852 K) with an absolute fixed measure of 0.05 [6].
The following combinations of conditions were organized, which will then be measured on the engine to verify the deviation from the estimated response to the real response.
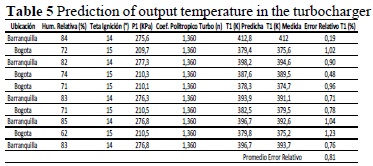
Note that the prediction in this stage is good, managing a maximum relative error level of 1.23%. Table 6 lists the results of the temperature prediction at the aftercooler output, where a maximum error of 4.1% was reached. This is due to the engine’s operating condition at partial load when performing the reading, which is why it is distant from the measurement condition of the other analysis points.
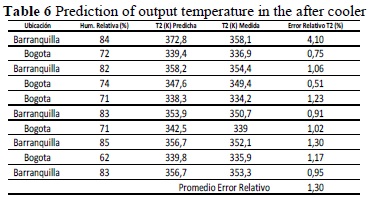
Table 7 lists the results of temperature predicted in the ignition point.
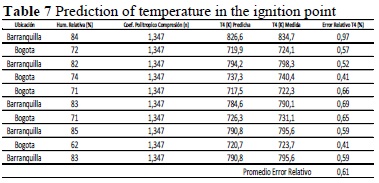
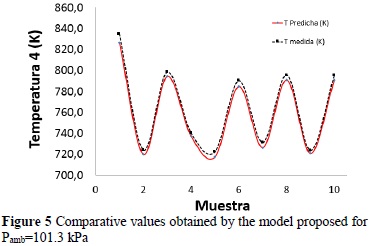
Note that although it is concatenated to previous temperatures, the temperature in the ignition point has a maximum relative error of 0.97%, which verifies that the model developed has prediction capacity, with a maximum error at +/- 1% (Figure 5).
It must be considered that the emission parameters (composition of exhaust gases) were kept constant. Emissions may be adjusted with parameter λ (real air-fuel ratio / stoichiometric air-fuel ratio), which was done in this case [14]. This procedure is used by manufacturers of natural gas engines to guarantee that engines are within international environmental standards.
3. Results and Analysis
From the study conducted, the influence of temperature and environmental pressure upon the self-ignition temperature was verified, corroborating that a 10% decrease in environmental pressure leads to a 4% increase in ignition point temperature, maintaining other parameters constant. This implies that if an engine operating in Barranquilla reaches an ignition point temperature 10 °C below the fuel’s self-ignition temperature and it is transferred to Bogotá with identical operating conditions (except for the environmental pressure) it will present self-ignition.
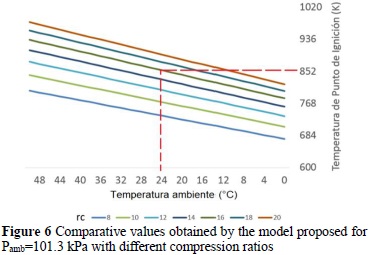
In addition, given the lower admission pressure (nearly 25% less), in Bogotá the engine would show loss of power because the effective mean pressure would diminish by around 15%, which would make the engine lose approximately 20% of its maximum power. The influence of environmental temperature on self-ignition is evidenced in Figure 6, where upon increasing environmental temperature, the ignition point temperature increases, hence, if the fuel self-ignition temperature is reached, the engine knock phenomenon appears. Likewise, it is also highlighted that higher tendency to self-ignition exists with increased compression ratio.
From the tables comparing theoretical results to real results (Tables 5, 6, and 7), it was observed that the average offset error between each of the stages of the cycle under analysis did not exceed 1%, which sheds light on the effectiveness of the method designed. As seen previously, the method was based on a characterization-prediction procedure.
The assumption made at the start of the formulation on the relative humidity not being significant was proven in Table 7 and Figure 6, given that the model did not lose prediction capacity, independent of the local relative humidity. This occurs due to the high volumes of fuel managed, the particular filtering system used in these types of engines, as well as the compression process in the turbocharger, which generates increased temperature that helps to mitigate this factor.
4. Conclusions
Use of synthesis gases in combustion engines is on the rise and has met limitations for greater development with the presence of the phenomenon of self-detonation and its relation to the engine’s efficiency. This is largely due the lack of studies on the behavior of gases during the process, particularly, in the compression stroke.
This study verified that increasing compression ratio increases the risk of self-ignition, which is why this defines a limitation in the process, given the problems generated in the engine by the self-ignition.
However, the study found that for the ignition angle the ratio is inverse. When diminishing the angle, the risk increases. This is because the piston reaches closer to the top dead center, thereby, the air-fuel mixture is further compressed, increases pressure and - in turn - increases temperature. To manage and control this variable, a control system is proposed varying the ignition angle, which would have the advantage of permitting the engine to be more flexible against disturbances in the environment that cause self-detonation.
It was also found that environmental pressure has a huge influence on the phenomenon of self-ignition. A 25% drop in environmental pressure causes an 18% increase in the tendency to self-detonation, which implies that it is necessary to diminish the power of the equipment by about 20% to compensate the pressure change without having engine knocking. The aforementioned is based on the fact that the mean effective pressure managed by the engine is better, which is directly proportional to the output power.
References
[1] Chen, Y., & Raine, R. (2015). A study on the influence of burning rate on engine knock from empirical data and simulation. Combustion and Flame, 162 (5), 2108-2118. [ Links ]
[2] Gururaja Rao, Sridhar. Experiments and Modelling Studies of Gas in Spark-Ignited Reciprocating Engines. Department of Aerospace Engineering Indian Institute of Science Bangalore, India, 2013. [ Links ]
[3] Buttsworth, David R. Spark Ignition Internal Combustion Engine Modelling using Matlab. Faculty of Engineering & Surveying Technical Reports. University of Southern Queensland. Australia, 2002. [ Links ]
[4] Goyal, Anurag. Conversion of a spark ignited, 4-stroke, CNG automotive engine to run on gas. Mechanical Engineering Department Indian Institute of Technology. India, 2011. [ Links ]
[5] Hernández, Juan J. Lapuerta, Magin. Estimation of the Laminar Flame Speed of Gas. Energy & Fuels 2005, 19, 2172-2178. 2005. [ Links ]
[6] Porpatham, E. Ramesh, A. Effect of compression ratio on the performance and combustion of a biogas fuelled spark ignition engine. Fuel (2011). 2011.10.059. [ Links ]
[7] Wark, Kenneth. Termodinámica Avanzada. Mc Graw-Hill. 2001. [ Links ]
[8] Heywood, J.B. Engine design and operating parameters. Internal combustion engine fundamentals (pp. 450-470) Mc Graw-Hill. 1988. [ Links ]
[9] Payri, F. Internal combustion engines alternative (pp. 39-40) REVERTÈ. 2001. [ Links ]
[10] Ganesan, V. Internal Combustion Engines. Third Edition. Mc Graw Hill. 2005. [ Links ]
[11] Kates, Edgar. Motores Diésel y de gas de alta compresión. Segunda edición. Editorial Reverte. 2003. [ Links ]
[12] Mongomery, Douglas C. Diseño y análisis de experimentos. Limusa Wiley, 2005. [ Links ]
[13] Ross, Sheldon. Introducción a la estadística. Segunda edición. Editorial Reverte. 2005. [ Links ]
[14] Porpatham, E. Ramesh, A. Effect of compression ratio on the performance and combustion of a biogas fuelled spark ignition engine. [ Links ]

