


 English (pdf)
 Article in xml format
 Article references
 Send this article by e-mail
 Cited by SciELO
  Cited by Google
  Similars in
SciELO
Similars in
SciELO  Similars in Google
 Permalink
INTRODUCTION
The genus Capsicum, commonly known as chili peppers, is part of the Solanaceae family and comprises more than 40 species of peppers (Barboza et al., 2020). Five of these species are domesticated (C. annuum L., C. frutescens L., C. chinense Jacq., C. baccatum L. (var. pendulum), and C. pubescens Ruiz & Pav). Based on phenotypic descriptors, these peppers species have been classified by flower morphology (shape, size, among others) and fruit variability (sizes, colors, shapes, degree of maturity, and pungency). Pepper fruits are consumed worldwide and have global economic importance because of their richness in vitamins (A, C, and B6), antioxidants, β-carotenes, flavonoids, anticancer agents, antimicrobials, pigments, flavorings, carotenoid oils, oleoresins, and alkaloids with insecticidal potential (Wahyuni et al., 2011).
In Colombia, the habanero pepper (C. chinense) is traditionally grown by small farmers but also commercially by big farms. More than 420 ha are distributed in the Valle del Cauca, Santander, and the Caribbean region, producing approximately 6,000 t of fruit for local consumption and export (Estrada and Baena, 2012). To meet domestic demands, crop improvement methods have been applied based on traditional selection (using phenotypic characteristics) to detect individuals with agronomic characteristics such as increased production, resistance to pests, and other environmental factors (Silva, 2011).
Ideally, the starting point for genetic improvement plans is determining the genetic diversity of the studied species, which elucidates the sufficient diversity for carrying out an artificial selection process (Ramírez et al., 2006). Unfortunately, in Colombia, there is a lack of genetic information on the cultivated habanero germplasm that impedes proper genetic improvement and conservation.
In general, the genetic diversity of plant populations can be estimated with morphological characteristics; however, they are strongly influenced by the environment: soil nutrition, parasites, viruses, and climatic adversities, among other factors. Thus, molecular markers have become the main tools for analyzing, assessing, and understanding plant genetic diversity (Tanksley, 1983). Markers characterized by tandem repeats, microsatellites or simple sequence repeats (SSR) are successfully used because of a high degree of polymorphism, high reproducibility, stability, ease of handling, codominant inheritance, and multiallelism (Nicolaı̈ et al., 2013).
The detection and identification of microsatellites in genotyping studies can be performed with different approaches, such as capillary electrophoresis, gel electrophoresis, and high-resolution dissociation curves, a technique known as High Resolution Melting (HRM) (Lee et al., 2016). In contrast to the other visualization methods for microsatellites, HRM is an RT-PCR technique that separates DNA molecules based on their composition and length, distinguishing changes in up to one nucleotide, as detected by differences in fluorescence with increasing temperature, allowing the genotyping and identification of individuals and populations (Xanthopoulou et al., 2014).
In Colombia, Hugo Restrepo and Cı́a and the Universidad Nacional de Colombia, Palmira campus, made an individual selection program from various commercial Habanero peppers available on the market. They were searching for high fruit productivity (kg per plant). As a result, they obtained two derived lines (HL-67 and HL-70). These derived lines and their original counterpart form part of the seedbank used for production (Estrada and Baena, 2012). However, it remains unknown whether there is enough genetic variability in these lines to perform another selection program to find a high level of pungency and molecular markers that accurately discriminate between lines and species.
This research estimated the genetic diversity within three lines in this bank, and the genetic differentiation with microsatellite markers was visualized using the HRM technique. This study provided a foundation for the conservation and future harnessing of these genetic material.
MATERIALS AND METHODS
Plant materials
Three Habanero pepper (C. chinense) lines in the seedbank of Hugo Restrepo and Cı́a were studied. One corresponded to an original Habanero pepper line (HL-original). The other two lines (HL-67 and HL-70) were derived by selection. Thirty seeds were chosen at random from each of the lines and were germinated in seedbeds for 35 days until 1 g of fresh foliar tissue was obtained. Subsequently, the tissue was placed in hermetic bags with silica gel as a moisture indicator (hydrous forms pink-colored, and anhydrous forms blue-colored) to dry and preserve it. The germination process was done at the experimental station at the Universidad del Valle, Cali.
DNA extraction
All molecular biology work (DNA extraction and genotyping) was done in the “Laboratorio de Biología Molecular” at the Universidad del Valle, Cali. DNA was extracted with the CTAB method of Doyle and Doyle (1987) with the modifications described by Stewart and Via (1993). The DNA was dissolved in 500 µL of LowTE and stored at -20º C. For three individuals in the HL-original group, it was not possible to extract DNA, so the final number of samples was 87.
The total DNA was quantified for the 87 samples using a NanoDrop™ 2000/2000c spectrophotometer to determine the DNA concentration and quality (260/280 and 260/230). Then, it was diluted to a concentration of 10 ng µL-1 for use in the laboratory.
Genotyping SSR by HRM
Three of the microsatellites reported by Lee et al. (2004) were used, which were referred to as Bd, along with the five reported by Nagy et al. (2007), which were referred to as Ng, following the nomenclature proposed by Guzmán et al. (2020), for a total of eight markers (Tab. 1).
Table 1. Microsatellites used for genotyping in C. chinense using the HRM technique, with their respective average melting point temperatures.
| Name | Locus | Melting point temperature (ºC) |
|---|---|---|
| Ng4 | CA515275 | 76.80 |
| Ng8 | CA516044 | 81.80 |
| Ng10 | CA516334 | 84.30 |
| Ng18 | CA517699 | 73.40 |
| Ng33 | CA516439 | 78.00 |
| Bd12 | Hpms1-139 | 78.20 |
| Bd17 | Hpms1-165 | 77.20 |
| Bd22 | Hpms1-214 | 78.29 |
The reactions were performed using the Bio-Rad CFX96 Real-Time System. For each HRM reaction, 5 µL of 2X Precision Melt Supermix reagent, 0.7 µM of each primer (forward and reverse), 35 ng of DNA, and 0.1 µL of distilled and deionized water were used in a total volume of 10 µL. The HRM analysis started with denaturation at 95ºC for 5 min, followed by 60 ºC for 1 min, 65 ºC for 30 s, and finally a temperature increases of 0.2 ºC for 10 s up to 95 ºC, where the change in fluorescence was recorded.
Data analysis
The different curve profiles obtained with the HRM technique were recorded using Precision Melt Analysis™ software v1.2. Each profile was identified as a genotype. Afterwards, all profiles obtained for the three C. chinense lines were compiled, an allelic matrix was constructed for each of the markers, and the parameters of diversity between the lines were calculated, such as the observed heterozygosity (Ho) and expected heterozygosity (He) (Crow and Kimura, 2009), number of alleles present, unique alleles, and number of haplotypes (genetic profiles). The Nei (1972) and Shannon-Wiener´s genetic diversity indices (Shannon, 1948) were used. The polymorphic information content (PIC) was also calculated for the three lines according to Botstein et al., (1980). These statistics were performed using GenAlex software version 6.503 (Peakall and Smouse, 2012).
Wright’s F-statistics were used to calculate the genetic differentiation of the C. chinense lines (HL-original, HL-67 and HL-70). Finally, a dendrogram was constructed using UPGMA with the paired FST’s to observe the differentiation between the three lines.
Genetic similarity analysis of the allelic matrix was performed using the Nei (1972) coefficient to perform all pairs of genotype comparisons. Finally, analysis of molecular variance (AMOVA) was performed to decompose the total genetic variance using Arlequin Version 3.5 (Excoffier and Lischer, 2010) with three levels: between lines, between individuals within lines, and individuals.
RESULTS AND DISCUSSION
Three microsatellites were monomorphic, and five were polymorphic. PIC values are presented in table 2.
Table 2. Informativeness parameters for the eight microsatellites utilized in this study,with number of alleles (Na), Effective Number of Alleles (ENA) and PIC (Polymorphic Information Content).
| Marker | Number of alleles | Effective number of alleles | PIC |
|---|---|---|---|
| Bd17 | 9 | 1.66 | 0.71 |
| Bd 22 | 2 | 1.07 | 0.18 |
| Ng 4 | 5 | 1.93 | 0.67 |
| Ng 8 | 3 | 1.83 | 0.38 |
| Ng 10 | 1 | 1.00 | 0.00 |
| Ng 18 | 1 | 1.00 | 0.00 |
| Ng 33 | 1 | 1.00 | 0.00 |
| Bd 12 | 4 | 1.74 | 0.43 |
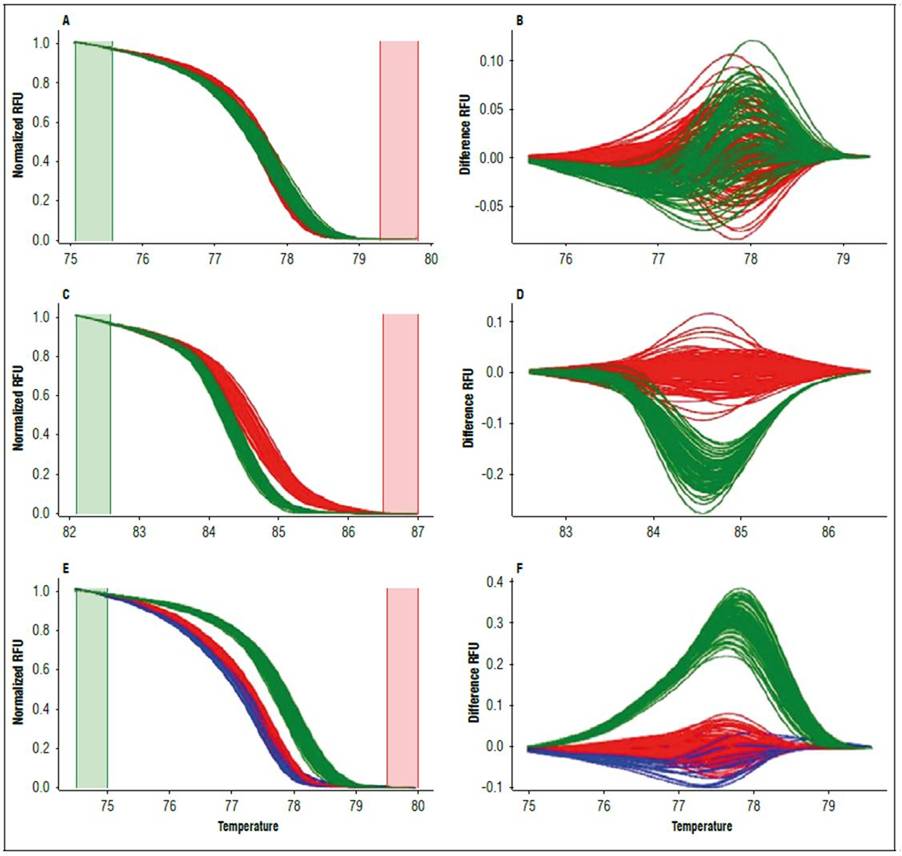
The Ng8 microsatellite differentiated the HL-70 individuals from the HL-67 and HL-original individuals (Fig. 1). Differences were observed in both the shape of the curve and the melting point. The genotype in HL-original and HL-67 (red curves in Fig. 1) had a melting point of 82.20°C, while the genotype found only in HL-70 (green curves in Fig. 1) had a melting point of 81.20°C.
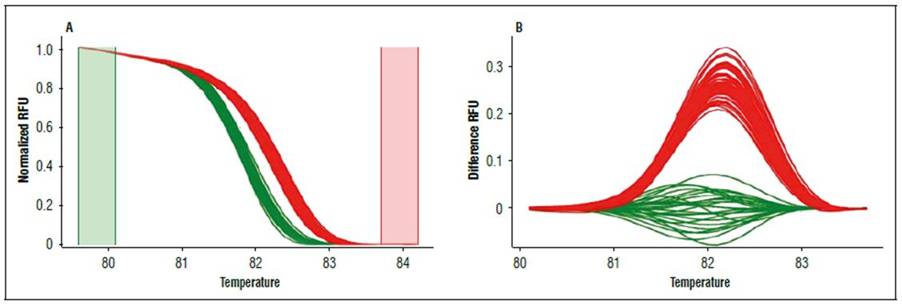
Figure 1. HRM analysis for microsatellite Ng 8 in C. chinense lines. A, normalized melting curves (normalized RFU vs. temperature (ºC)), B, differentiation curves (difference RFU vs. temperature (ºC)). Red curves represent genotype one present in the HL-original and HL-67 lines, while green represent genotype 2 in the HL-70 line.
Sanger sequencing was performed for the Ng8 marker for two individuals from HL-70 and HL-67 to specify the differences in the clusters obtained in HRM. The results showed that the HL-70 line carried a deletion of one nucleotide in position 142, while the HL-67 and HL- original lines had one adenine inserted in this position (Fig. 2).
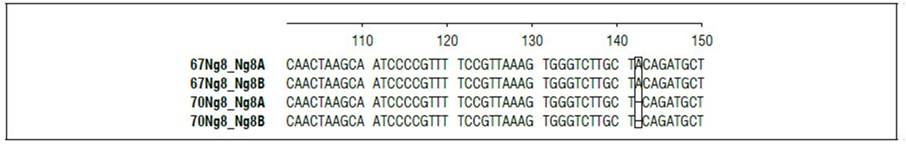
Figure 2. The sequence of lines (67 and 70) of C. chinense (two individuals for lines A and B) with Ng8 marker. -The square shows the indel identified in position 142.
The analysis of the genetic diversity of the five polymorphic loci revealed differences in the number of haplotypes: 20 for HL-original, 10 for HL-70, and 5 for HL-67 (Tab. 2). The Shannon-Wiener index (Shannon, 1948) value showed that the most diverse line was HL-original, followed by HL-67 and HL-70 (Tab. 3).
Table 3. Genetic parameters generated by the five SSR markers on three C. chinense lines. Ho: observed heterozygosity, He: expected heterozygosity.
| C. chinense lines | Locus | Number of alleles | Ho | He | Number of haplotypes | Shannon-Wiener index |
|---|---|---|---|---|---|---|
| HL-original | Ng4 | 5 | 0.00 | 0.64 | 20 | 0.55 |
| Ng8 | 1 | 0.00 | 0.00 | |||
| Bd12 | 3 | 0.00 | 0.50 | |||
| Bd22 | 2 | 0.00 | 0.07 | |||
| Bd17 | 9 | 0.00 | 0.78 | |||
| HL-67 | Ng4 | 2 | 0.00 | 0.07 | 5 | 0.22 |
| Ng8 | 1 | 0.00 | 0.00 | |||
| Bd12 | 3 | 0.00 | 0.53 | |||
| Bd17 | 1 | 0.00 | 0.00 | |||
| Bd22 | 2 | 0.00 | 0.07 | |||
| HL-70 | Ng4 | 2 | 0.00 | 0.14 | 10 | 0.18 |
| Ng8 | 2 | 0.00 | 0.18 | |||
| Bd12 | 3 | 0.00 | 0.13 | |||
| Bd17 | 5 | 0.00 | 0.25 | |||
| Bd22 | 2 | 0.00 | 0.13 |
Since the Ng8 marker detected differences among the evaluated lines, the objective was to observe its effect on the variation between and within lines through two analyses of variance, one including it and another excluding it. Upon inclusion of Ng8, the most significant variation was found within lines, followed by between lines and, finally, null variation within individuals. Upon excluding Ng8, the variation within lines increased to 0.71, while between lines, it decreased to 0.29 (Tab. 4). In contrast, Wright’s F-statistics determined the level of inbreeding within lines (FIS) and total inbreeding (FIT), both of which had a value of 1. In FST, the degree of differentiation between lines had a value of 0.48.
Table 4. Analysis of molecular variance in three lines of C. chinense.
| Source of variation | Sum of squares | Variance components | Percentage of variation | Sum of squares | Variance components | Percentage of variation |
|---|---|---|---|---|---|---|
| Including Ng 8 | Excluding Ng 8 | |||||
| Between lines | 62117 | 0.520 | 48.0* | 26405 | 0.21 | 29.0* |
| Within lines between individuals | 93935 | 0.570 | 52.0* | 86400 | 0.51 | 71.0* |
| Within individuals | 0 | 0.000 | 0.0* | 0 | 0.00 | 0.0 |
| Total | 156053 | 109.102 | 112805 | 0.72 | ||
The Ng8 marker was included in the first analysis and excluded in the second one.
* The percentages of variation were significant, P<0.05.
The dendrograms constructed with UPGMA based on FST pairs, including Ng8, revealed less differentiation between lines HL-67 and HL-original than line HL-70 (Fig. 3A). In contrast, exclusion of the Ng8 marker from the analysis showed the opposite effect, in which there was less differentiation between lines HL-67 and HL-70 than the HL-original (Fig. 3B).
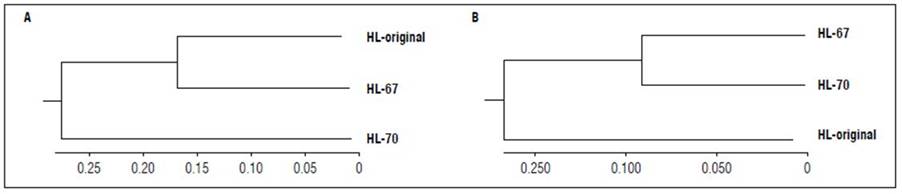
Figure 3. UPGMA dendrogram based on paired FST of lines HL-original, HL-67, and HL-70. A) Including of the Ng8 marker. B) Excluding of the Ng8 marker.
Similarity analysis was performed based on the genetic distances calculated using Nei’s (1972) similarity coefficient, including and excluding the Ng8 marker, as shown in figure 4A and 4B. The genetic diversity estimated in the original line was more significantly similar to HL-67 than to HL-70.
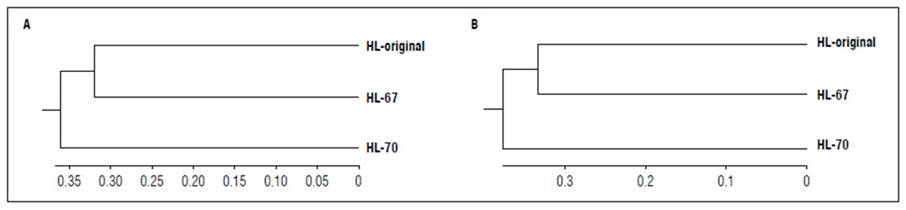
Figure 4. UPGMA dendrogram based on Nei’s (1972) similarity coefficient between lines HL-original, HL-67, and HL-70. A) Inclusion of the Ng8 marker demonstrated a higher similarity between HL-original and HL-67 and a lower similarity between HL-70 and the two lines evaluated. B) Exclusion of the Ng8 marker revealed no differences in the position and order of the lines.
Finally, the C. chinense genotypes detected with the Ng10, Ng18, and Ng33 markers were compared with some from C. frutescens individuals. The comparison differentiated these two Capsicum species (Fig. 5).
DISCUSSION
Genetic diversity and population structure
This study was the first to address the genetic diversity estimated with microsatellites using the HRM technique in the cultivated germplasm of C. chinense in the Valle del Cauca Department. The microsatellites Ng10, Ng18, and Ng33 were monomorphic, while the marker Bd22, according to the classification of Botstein et al. (1980), was slightly polymorphic, with a PIC = 0.18 (Tab. 2). Guzmán et al., (2020) worked with the same markers in a germplasm bank of Capsicum spp. and found high PIC values in wild populations of C. chinense. The low PIC values obtained for the evaluated lines can be explained by the genetic diversity reduction caused by the selection process used in this plant material, as evidenced by the allelic reduction of the derived lines HL-70 and HL-67 (Tab. 3). Similar results were found by Marcos-Pérez et al. (2013) and Rivera et al. (2016) in C. annuum Spanish populations.
The Ng4, Ng8, Bd12, and Bd17 markers were polymorphic (Tab. 2); nonetheless, they reduced allelic richness because of selection and genetic drift. According to Botstein et al. (1980), Bd17 (PIC=0.70) and Ng4 (PIC=0.62) were highly informative, and Bd12 (PIC=0.43) and Ng8 (PIC=0.38) were moderately informative. Remarkably, the polymorphism obtained for Ng8 differentiated HL-70 from HL-original and HL-67 because of two unique genotypes present in HL-70 (Fig. 1). Thus, this marker is proposed for identifying the HL-70 line. The Bd17 and Ng8 markers are proposed for identifying the HL-67 line. Despite having the highest PIC index, Bd17 was monomorphic in this line. Consequently, by combining these results with those obtained for the Ng8 marker, individuals belonging to this line can be successfully identified.
According to Wright´s classification, the average differentiation between lines (FST= 0.48) was high, compared to the FST obtained in natural populations of C. chinense. A study conducted by Contreras-Toledo et al., (2011) obtained FST values between 0.10 and 0.17, as explained by the effect of gene flow between the five evaluated populations. The opposite occurred for the three lines in the present research, where the gene flow was very restricted. Therefore, the effect of genetic diversity homogenization between lines was diminished, and their differentiation was promoted, conserving the genetic integrity as proposed by Wright’s Island model (Wright, 1931; Estrada and Baena, 2012).
In the dendrogram based on paired FST, including Ng8, the genetic distance between lines HL-original and HL-67 was 0.17 and 0.26 between HL-original and HL-70 pair (Fig. 2A), which is congruent with the Nei (1972) similarity coefficients (Fig. 4A). This result can be explained by the number of polymorphic loci of the HL-67 line (Tab. 3).
When excluding Ng8 (Fig. 3B), the differentiation between lines decreased from 48% (P<0.01) to 29% (P<0.01) (Tab. 3), which enhanced the estimation of its effect on variation between and within lines. The Ng8 marker was monomorphic for the HL-original and HL-67 lines; nonehteless, it differentiated them from the HL-70 line (Fig. 1). In addition, Ng 8 caused little differentiation between the HL-original and HL-67 lines, which share the same genotype. Therefore, there was less differentiation between them following its exclusion from the derivative lines HL-67 and HL-70 (Fig. 3B). This result can be explained by the selection for increased productivity.
In contrast, the variation within lines increased from 52 to 71% (Tab. 4) because of the effect of the Ng8 marker, which defined the similarity between monomorphic haplotypes with only one allele in the lines HL-original and HL-67 lines. In the HL-70 line, Ng8 was slightly polymorphic (Botstein et al., 1980), as evidenced in the Nei (1972) dendrogram (Fig. 4A). When excluding this marker from the Nei (1972) similarity dendrogram (Fig. 4B), there were no changes in the position of the evaluated lines because the Nei (1972) similarity analysis algorithms are based on absence presence scores, ignoring the characteristic´s state. Therefore, the effect of Ng8 on differentiating the HL-original, HL-67 and HL70 lines was inconspicuous.
The lines had excess homozygotes (Tab. 3), as found in studies and analyses carried out by Lee et al. (2016) using 48 single nucleotide polymorphisms (SNPs) and the HRM technique. These authors found a heterozygosity of 0.11 in 105 C. chinense individuals. These results are also similar to those obtained by González-Pérez et al. (2014), who evaluated the population structure of several Capsicum species, including C. chinense in the germplasm bank of Zaragoza, Spain, using 39 microsatellites and capillary electrophoresis and obtained a Ho = 0.12. Another study conducted by Zhang et al. (2016) on 388 Capsicum spp. individuals from a germplasm bank in China using microsatellites with capillary electrophoresis found Ho values between 0.13 and 0.15 for C. annuum. These values are very similar to the Ho = 0.12 found by Lee et al. (2016) using HRM in 3383 C. annuum individuals.
These studies confirmed that Ho levels do not depend on the technique and may be due to the autogamous reproduction of the Capsicum species. Some authors have claimed that autogamy levels range from 0.90 to 0.95 (Odland and Porter, 1941, Justino et al., 2018), which explains the few heterozygotes detected in these studies. The heterozygosity of 0% for all loci evaluated in the three lines was also found by Yumnam et al. (2012) using 56 Capsicum individuals from eight Indian wild populations and 24 SSR loci. Half of the loci presented a Ho = 0, which was justified by the high degree of autogamy in the evaluated lines.
In the three lines studied here, cross-fertilization among individuals was avoided to preserve the genetic integrity of the selected lines (Estrada and Baena, 2012), clarifying the absence of heterozygotes or their low detection frequency with a sample size of 30 individuals. Therefore, autogamy could explain the AMOVA results, showing the most significant genetic variation component within the lines (52%) (Tab. 4). Similarly, Oyama et al. (2006) estimated the genetic diversity of C. annuum domesticated lines in 3 Mexican localities using microsatellites, and their results revealed that the most significant components of variation were within populations (51%). Consequently, these results could explain the high genetic diversity and variability of homozygotes despite autogamy. Hence, the three lines studied here were formed by different genetic profiles (haplotypes), which explained the distinct haplotypes in the HL-original, HL-67, and HL-70 lines, 20, 5, and 10, respectively (Tab. 3).
Conservation and plant breeding aspects
These results showed that it is possible to develop a selection program within the lines to take advantage of the genetic variation in the three evaluated lines. Because of its high diversity, the HL-original line might be still helpful to build new lines for increased production and pathogen resistance; hence, it should be conserved in the company’s germplasm bank. HL-70 presented half of the haplotypic diversity of HL-original and high allelic variability; thus, it could increase pungency. In contrast, HL-67 had lower allelic and haplotype diversity than the other lines (Tab. 3). Thus, it was not feasible to continue increasing production or another interest variable because this line only presented three of the five polymorphic loci, representing the line with the most outstanding genetic homogeneity. As the most genetically homogeneous line, it could be used evaluate different environmental conditions to determine the optimum environment for achieving optimal productivity.
Usually, observed heterozygosity is used to estimate the genetic diversity of a population/line when codominant markers are used since Ho may represent the maximum genetic variability available in a population, which is helpful in breeding or conservation programs. However, if the studied species presents high levels of autogamy, the use of Ho can underestimate the genetic diversity of a population since self-pollination lowers heterozygosity levels and then genetic diversity tends to remain in different kinds of homozygotes instead of the heterozygote individuals (Falconer and Mackay, 2006). Therefore, the use of other estimators such as expected heterozygosity or number of haplotypes is recommended to accurately estimate the genetic diversity of crops with high autogamy levels, as done with the Capsicum lines.
Discrimination between habanero lines
The absence of the one allelic variant in the HL-original might have two explanations. First, a founder effect was due to selection process, where the allelic variant found in HL70 was less frequent in HL-original because of the small sample size, which indicated that allelic variant 1 (Fig. 1) was the most frequent. Similarly, the selection process caused a bottleneck that reduced allelic diversity through a founder effect and led to the increased allelic frequency observed in HL-70.
The second explanation might be that the HL-70 line developed a de novo mutation at this allelic difference. Based on the sequencing results, the differentiation was caused by the presence and absence of one nucleotide in the HL-original, HL-67 and HL-70 lines; however, it is unlikely that it occurred simultaneously in several individuals during the selection of the derived lines.
In any case, this result is valuable because discrimination between lines is helpful in a breeding program that aims to easily identify an improved line, is fast and is relatively low-cost.
Discrimination between C. frutescens and C. chinense species
Alleles detected with markers Ng10, Ng18, and Ng33 in the three lines were compared with the C. frutescens studied by Viafara-Vega and Cárdenas-Henao (2018), demonstrating that they differentiated C. chinense from C. frutescens (Fig. 5). These findings have not been previously reported. In the case of Ng10 and Ng18, they had several repetitions that detected differences based on discrepancies between the curve shape, the melting temperature, and polyacrylamide gels. For Ng 33, the differences between the two Capsicum species may have been due to few nucleotide bases because the polyacrylamide profiles were similar. The variability of these three markers and the resolution of the HRM technique could facilitate molecular discrimination of the two species, complementing the morphological attributes used by the private company Hugo Restrepo y Cía and discriminating at any plant stage, even in sprouts, because DNA extraction for the SSR-HRM analysis requires a small amount of leaf tissue.
CONCLUSION
The genetic diversity analysis presented relevant results using microsatellite markers with the HRM technique. Markers Ng4, Bd12, and Bd17 are ideal for studying and estimating the genetic diversity of C. chinense populations because of their high PIC values. Bd17 and Ng8 were used to recognize the HL-67 line: additionally, Ng8 was used to identify the HL-70 line because it detected two unique alleles in the evaluated individuals. The C. chinense lines had high levels of autogamy, conserving genetic diversity based on homozygotes. The AMOVA results for the within-line variation showed that the HL-70 line could continue to be pressured by selection to increase productivity because of the genetic variation estimated between the individuals. However, based on the allelic diversity observed for HL-original, its use is proposed to develop selection methods and achieve new improved lines. For the high genetic homogeneity of line HL-67, evaluations of different environmental conditions are proposed to determine optimum conditions that maximize production. Finally, the three markers (Ng10, Ng18, and Ng33) could facilitate routine molecular identification of the species C. chinense and C. frutescens for Hugo Restrepo and Cía.

